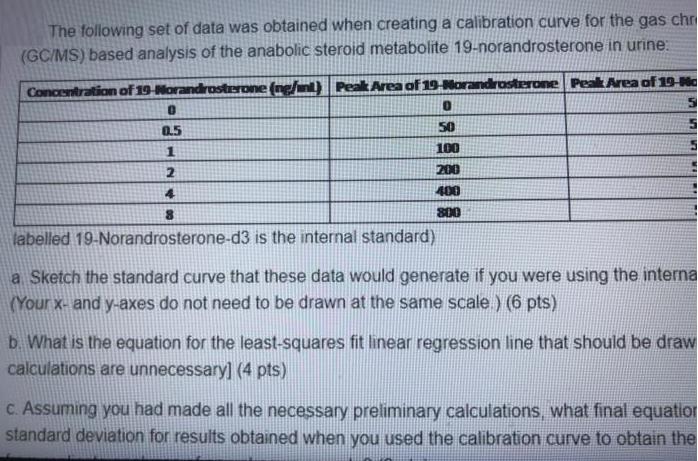
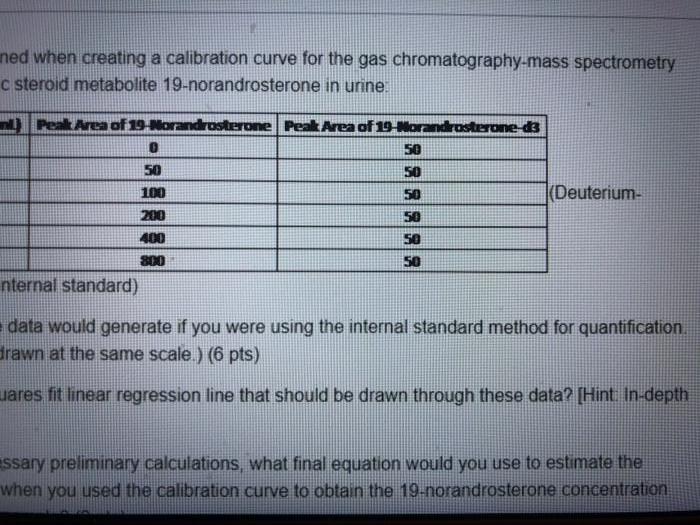
The following set of data was obtained when creating a calibration curve for the gas chr (GC/MS) based analysis of the anabolic steroid metabolite


The following set of data was obtained when creating a calibration curve for the gas chr (GC/MS) based analysis of the anabolic steroid metabolite 19-norandrosterone in urine: Concentration of 19-Norandrosterone (ng/nt) Peak Area of 19-Morandrosterone Peak Area of 19- 0.5 50 100 200 400 300 labelled 19-Norandrosterone-d3 is the internal standard) a Sketch the standard curve that these data would generate if you were using the interna (Your x- and y-axes do not need to be drawn at the same scale ) (6 pts) b. What is the equation for the least-squares fit linear regression line that should be draw calculations are unnecessary] (4 pts) C. Assuming you had made all the necessary preliminary calculations, what final equation standard deviation for results obtained when you used the calibration curve to obtain the WI ned when creating a calibration curve for the gas chromatography-mass spectrometry c steroid metabolite 19-norandrosterone in unine: ) Peak Area of 19-Norandrosterone Peak Area of 19-Morandrosterone-d3 50 50 50 100 50 Deuterium- 200 50 400 50 50 nternal standard) data would generate if you were using the internal standard method for quantification drawn at the same scale.) (6 pts) uares fit linear regression line that should be drawn through these data? [Hint in-depth ssary preliminary calculations, what final equation would you use to estimate the when you used the calibration curve to obtain the 19-norandrosterone concentration
Step by Step Solution
3.55 Rating (152 Votes )
There are 3 Steps involved in it
Step: 1
a The standard curve considering the concentration ngml i...
See step-by-step solutions with expert insights and AI powered tools for academic success
Step: 2

Step: 3

Ace Your Homework with AI
Get the answers you need in no time with our AI-driven, step-by-step assistance
Get Started


