

Question
Imagine that you are hired as a data analyst for a bank. The bank would like to learn more about its customers spending and banking
Imagine that you are hired as a data analyst for a bank. The bank would like to learn more about its customers spending and banking habits to identify areas of improvement. You have been asked to review the banks income statements over the last 5 years and identify trends that will allow them to better understand their customers.
Download your chosen banks annual income statements from the last 5 years from the Mergent database.
Identify three variables or categories that the bank may be interested in further researching, such as sales or revenue. Using these three variables or categories, build a frequency table, a bar chart, and a pie chart using Excel.
After creating the three tables, which of the tables and charts do you find most useful for communicating information about the banks customers? Write a brief case report summarizing your analysis and results.
- Identify three variables in the income statements that the bank may be interested further researching to learn more about its customers.
- Develop a frequency table, a bar chart, and a pie chart using variables in the income statements for your bank.
- Analyze the table and charts to find the most useful information for communicating information about the banks customers.
- Summarize your analysis and results, including how the charts were useful in your research.
Thank bank I have chosen is American Bank Corp. 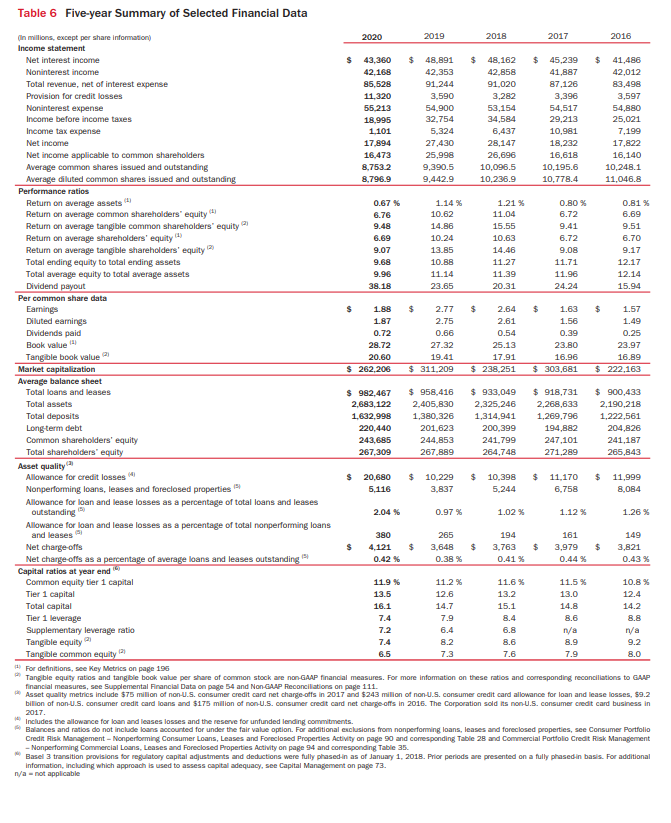
Table 6 Five-year Summary of Selected Financial Data (1) For definitions, see Key Metrics on page 195 Tangble equity ratios and tanglble book value per share of common stock are non-GAPP financal measures. For more information on these ratios and coeresponding reconciliations to Gap financial measures, see Supplemental Financial Data on poge 54 and NongAp feconcilationa on page 111. Asset qualty metrics include $75 milion of non-U.S. consumer credit card net charge-olfs in 2017 and $243 milion of non-U.S. consumer credit card allowance for loan and lease losses, $9.2. bilion of nonU.S. consumer credit card loans and $175m ilion of nonU.S. consumer credt card net chargeoffts in 2016 . The Corporation sold its nonU.S. consumer credit card business in 2017. 15. Includes the allowance for loon and leases losses and the reserve for unfunded lending commitments. Balances and ratios do not include loans socounted for under the fair value option. For additional exclusions from nonperforming loans, leases and foreciosed peoperties, see Consumer Portfolio Credit flisk Management - Nonperforming Consumer Loans, Leases and Foreciosed Properties Activity on page 90 and conesponding Table 28 and Commercial Portlolo Credt Fisk Management - Nonperforming Commercial Loons, Leases and Foreclosed Properties Acthity on page 94 and corresponding Table 35. Basel 3 traraition peovisions for regulatory capital adjustments and deductions were fully phased in as of Januay 1, 2018. Prior periods are presented on a fully phased in basis. For additional information, includ
Step by Step Solution
There are 3 Steps involved in it
Step: 1

Get Instant Access to Expert-Tailored Solutions
See step-by-step solutions with expert insights and AI powered tools for academic success
Step: 2

Step: 3
Ace Your Homework with AI
Get the answers you need in no time with our AI-driven, step-by-step assistance
Get Started
Quantitative Financial Risk Management
Authors: Constantin Zopounidis, Emilios Galariotis
1st Edition
1118738187, 978-1118738184