

Question
Imagine we have collected a random sample of 31 energy bars from a number of different stores to represent the population of energy bars available
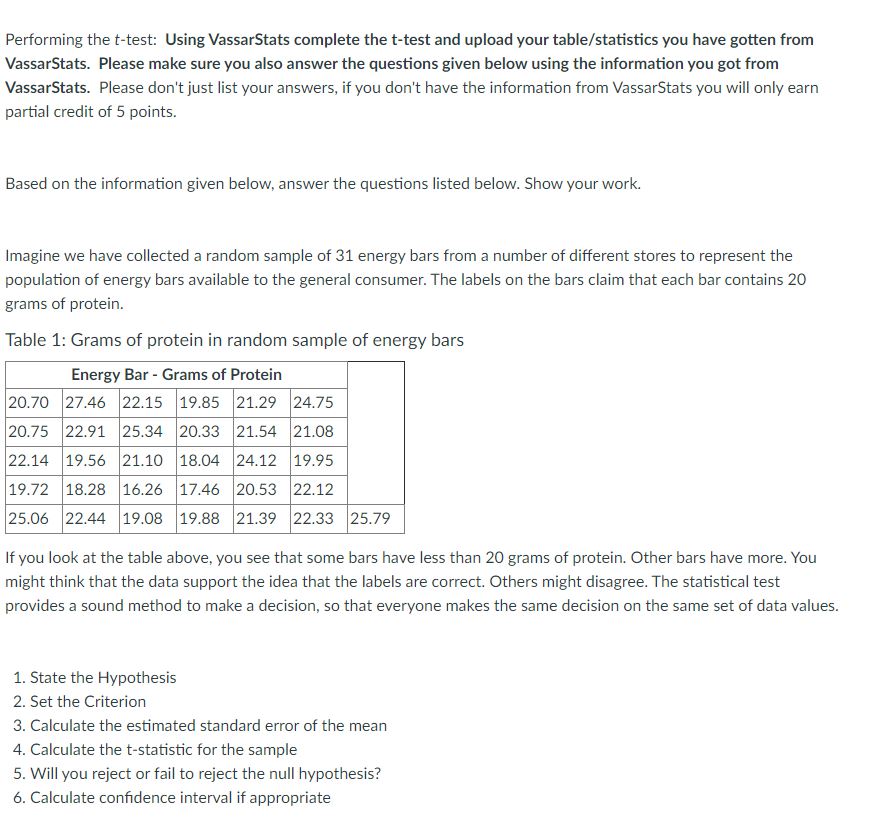
Imagine we have collected a random sample of 31 energy bars from a number of different stores to represent the population of energy bars available to the general consumer. The labels on the bars claim that each bar contains 20 grams of protein.
Table 1: Grams of protein in random sample of energy bars
| Energy Bar - Grams of Protein | ||||||
|---|---|---|---|---|---|---|
| 20.70 | 27.46 | 22.15 | 19.85 | 21.29 | 24.75 | |
| 20.75 | 22.91 | 25.34 | 20.33 | 21.54 | 21.08 | |
| 22.14 | 19.56 | 21.10 | 18.04 | 24.12 | 19.95 | |
| 19.72 | 18.28 | 16.26 | 17.46 | 20.53 | 22.12 | |
| 25.06 | 22.44 | 19.08 | 19.88 | 21.39 | 22.33 | 25.79 |
If you look at the table above, you see that some bars have less than 20 grams of protein. Other bars have more. You might think that the data support the idea that the labels are correct. Others might disagree. The statistical test provides a sound method to make a decision, so that everyone makes the same decision on the same set of data values.
- State the Hypothesis
- Set the Criterion
- Calculate the estimated standard error of the mean
- Calculate the t-statistic for the sample
- Will you reject or fail to reject the null hypothesis?
- Calculate confidence interval if appropriate
Step by Step Solution
There are 3 Steps involved in it
Step: 1

Get Instant Access to Expert-Tailored Solutions
See step-by-step solutions with expert insights and AI powered tools for academic success
Step: 2

Step: 3
Ace Your Homework with AI
Get the answers you need in no time with our AI-driven, step-by-step assistance
Get Started
Linear Algebra with Applications
Authors: Steven J. Leon
7th edition
131857851, 978-0131857858