Question
Imagine you are considering a Canola, HRS Wheat, Canola, HRS Wheat rotation in the Black soil zones and a Green Lentil, Durum, Chickpea, Durum rotation
Imagine you are considering a Canola, HRS Wheat, Canola, HRS Wheat rotation in the Black soil zones and a Green Lentil, Durum, Chickpea, Durum rotation for the Brown soil zone.
Calculate the returns to land, management, and risk using the 2023 Crop Planning Guide. Direct Costs would be the variable costs for each crop, and these include labour costs.
| Black soil zone | Brown soil zone | |||||||
| Canola | HRSW | Canola | HRSW | Green lentil | Durum | Chickpea | Durum | |
| revenue | ||||||||
| Direct costs | ||||||||
| Gross margin | ||||||||
| Machinery, building, overhead, taxes, depreciation | ||||||||
| Returns to land management, and risk |
- What is the capitalization value for land in these two soil zones under the following discount rates (5%, 8%, 10%)
- Calculate the Price to Value at these discount rates (5%, 8%, 10%) if land in the Brown Soil Zone is selling for $2200 per acre. and if land in the Black Soil Zone is selling for $3000 per acre.
Now assume you are a landowner who owns a tract of land in the black soil zone that you purchased a number of years ago for $2900 per acre. You are considering stepping away from farming and renting the land out to a neighbouring farmer. Assume your costs of ownership are 7% on invested capital, 0.5% of depreciation on fences, drainage, etc., taxes of 1.5% and Insurance is 1%.
- Using the above information, what are your annual costs of ownership?
- If the renter charges themselves 8% of gross sales for management and risk bearing, what rental rate could you charge based on the tenants residual net income? (Continue to use the data from the Crop Planning Guide that you used in the first part of this assignment).
Assume you want to purchase 320 acres in the Black soil zone that generates similar returns as seen above. Land came up for auction and you were the winning bidder at $3,300 per acre. You have enough retained earnings to put 40% of the purchase price down and the rest is being financed over 20 years.
- Calculate the annual principal and interest payments if the interest rate is 9% under the following payment scenarios.
a. Equal payments. b. Equal principal payments. c. Which scenario has the lowest cost of debt? What is the difference? d. Why might a borrower choose the more expensive option?
Please help me. I have already posted the question but no one will answer it
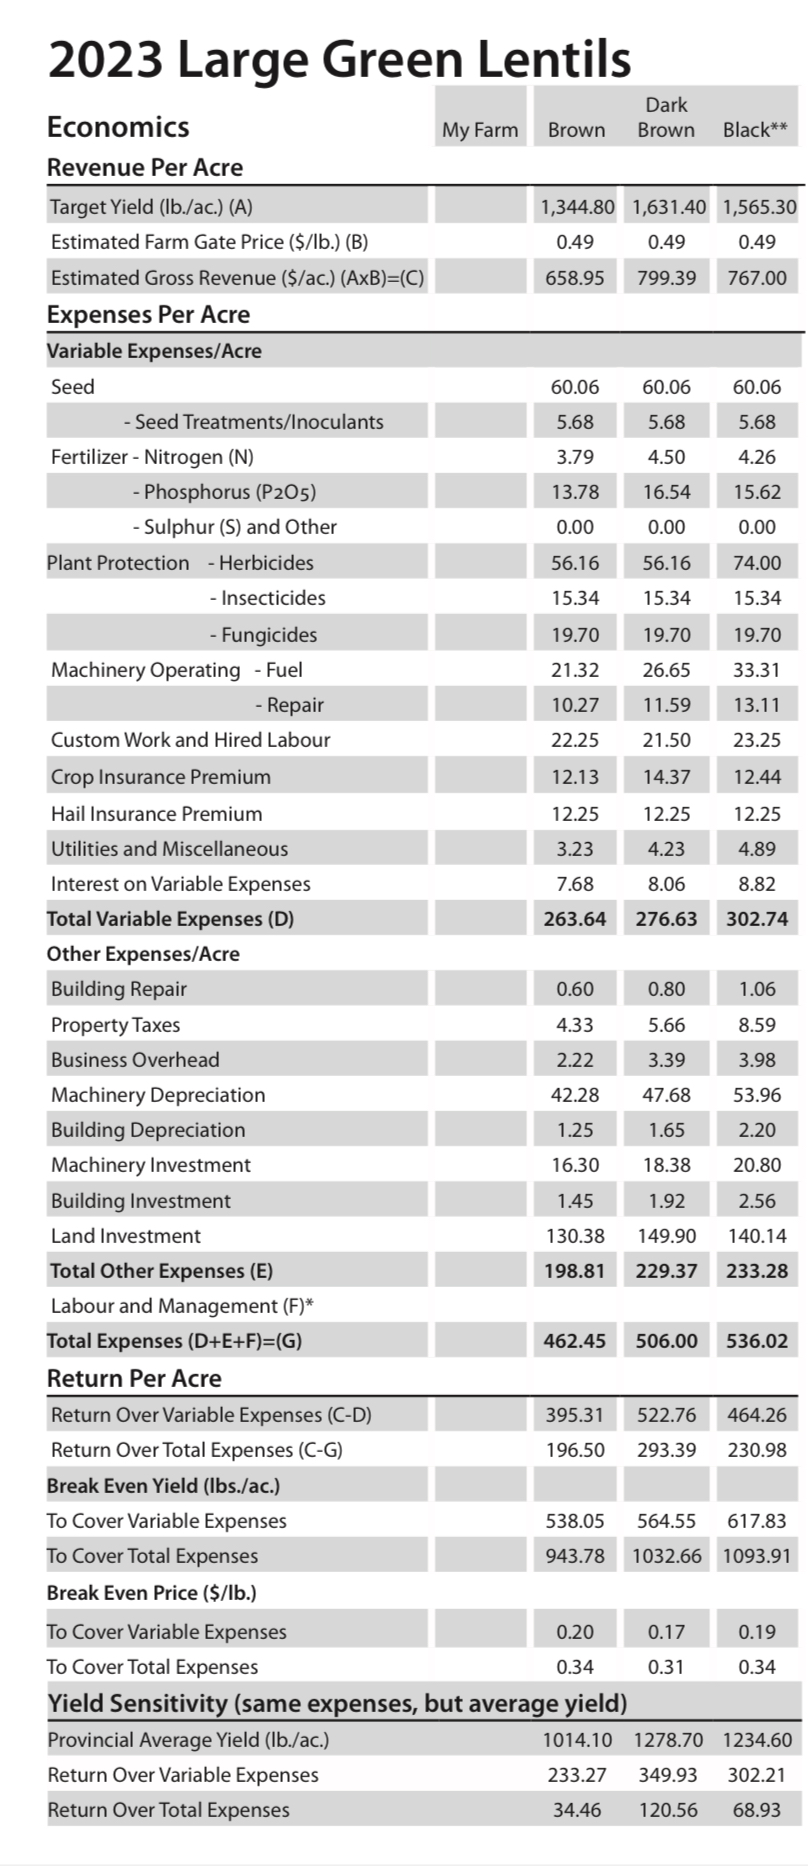
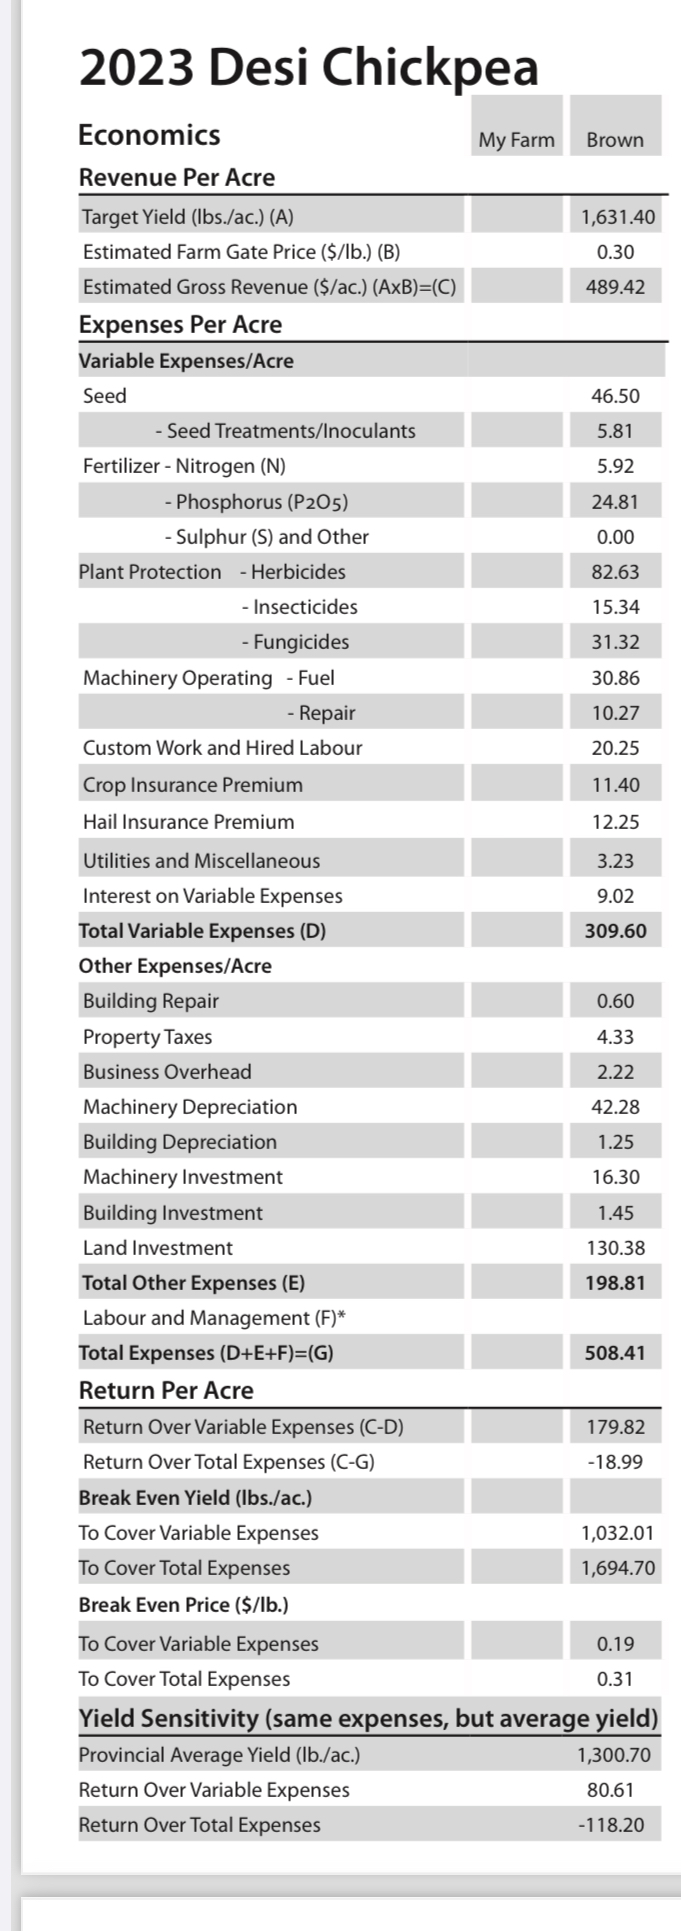
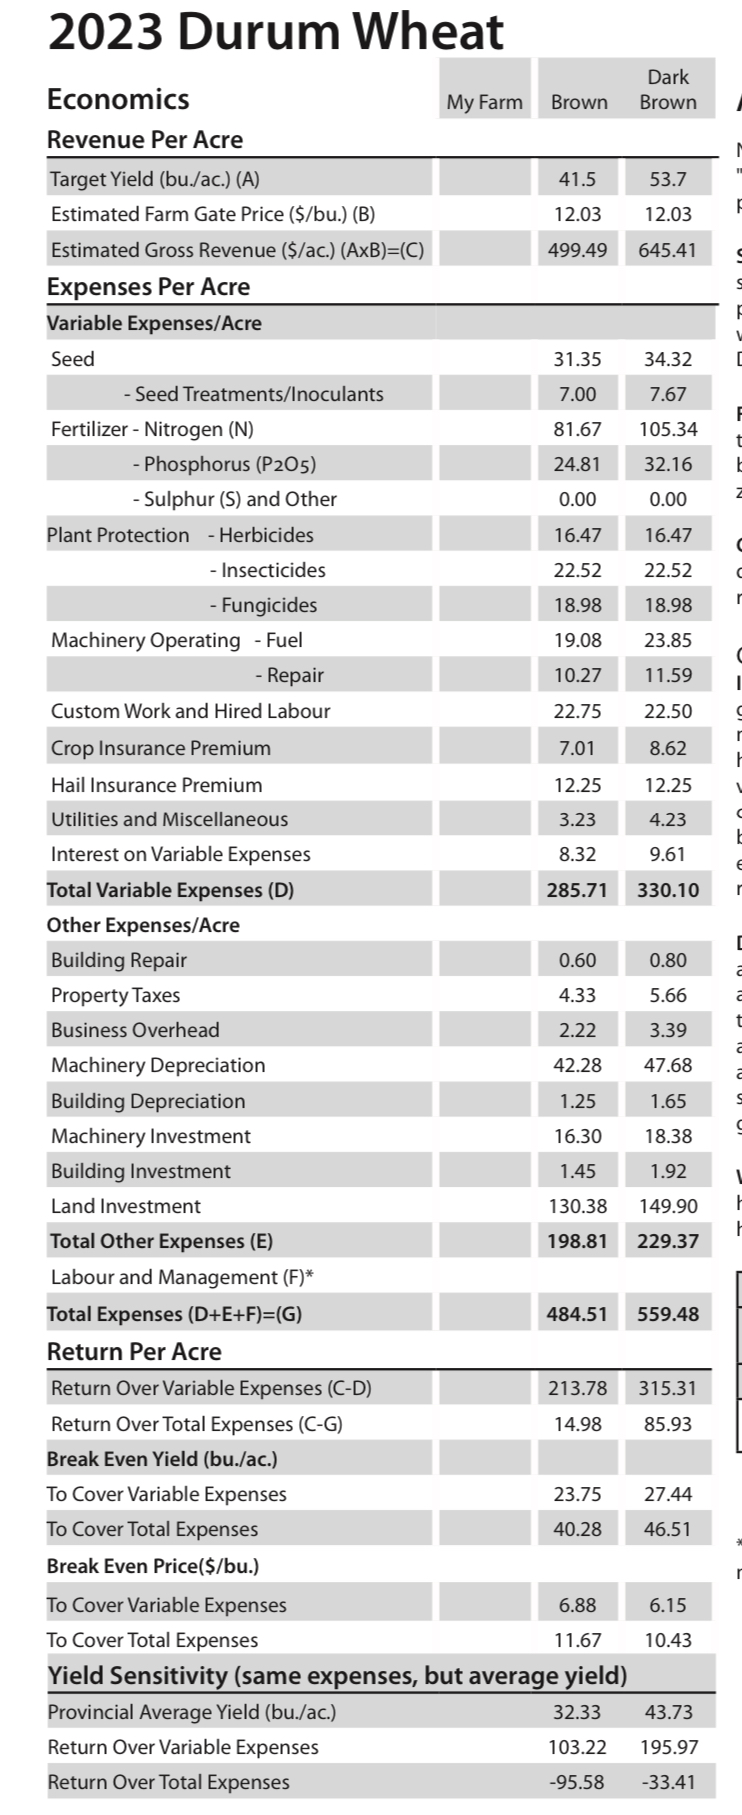
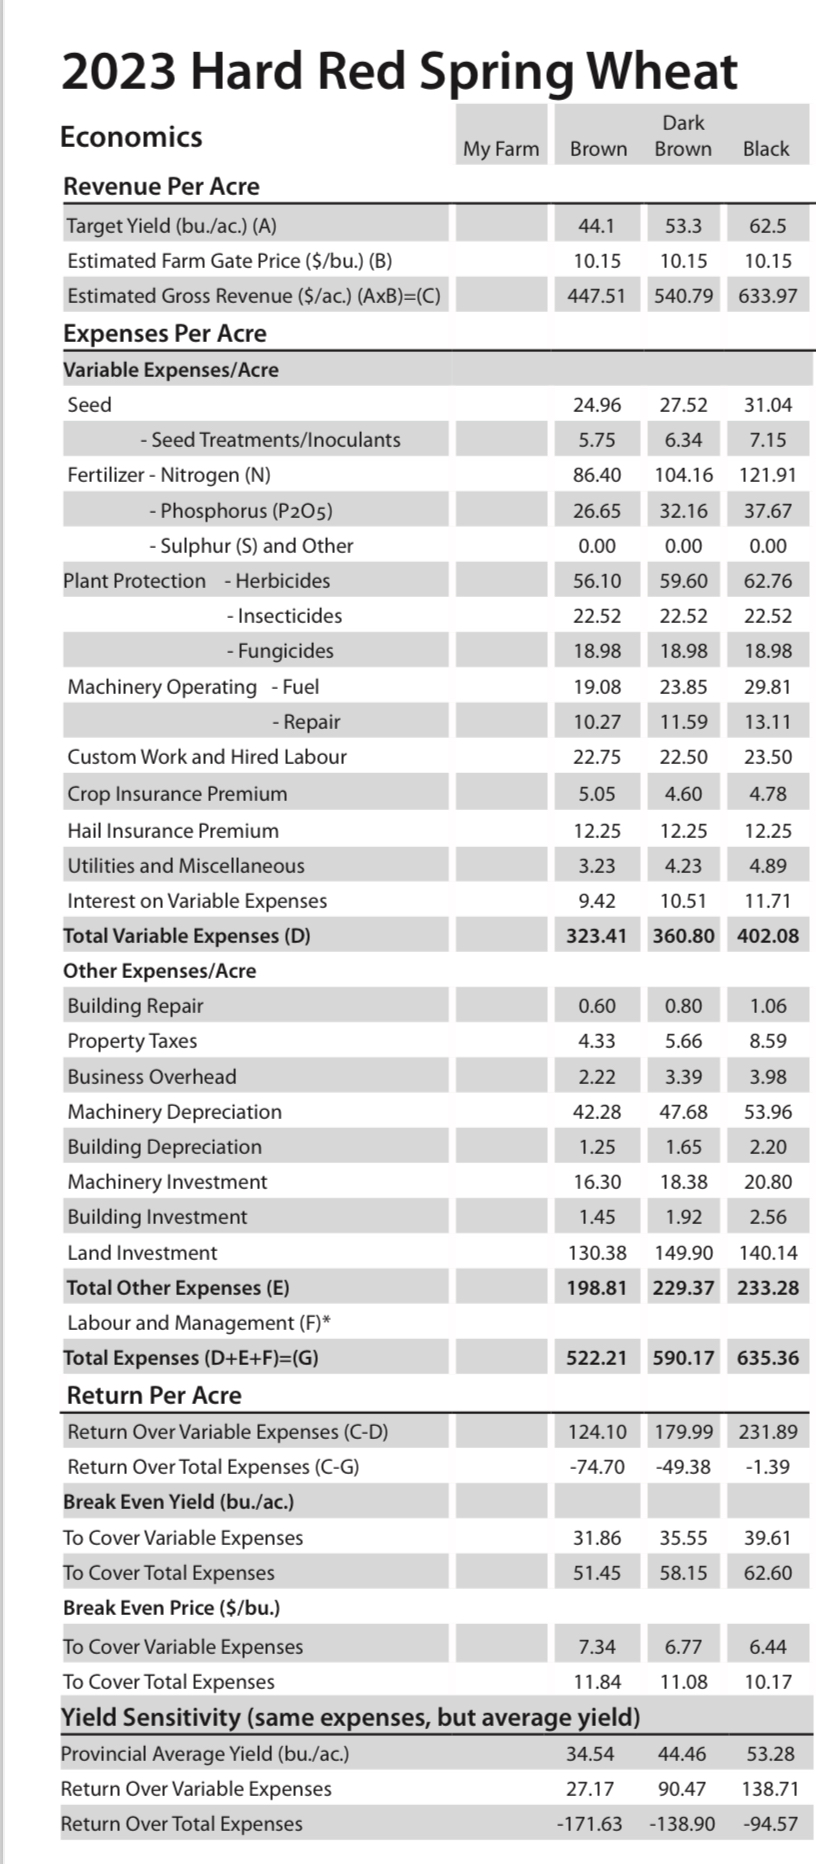
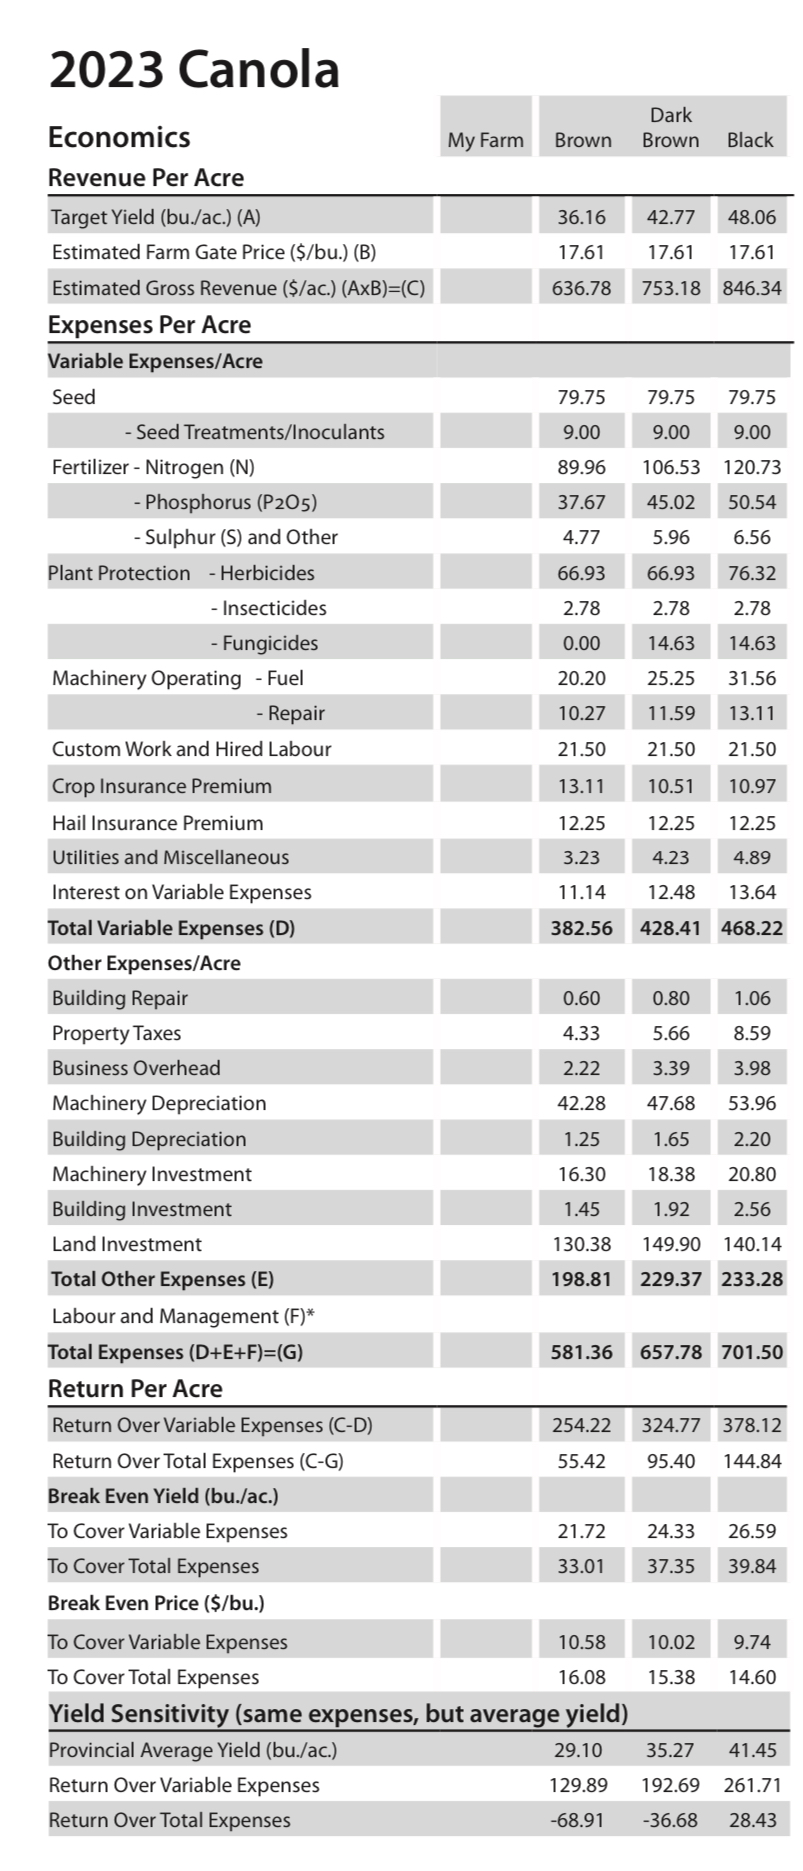
- 2023 Large Green Lentils Economics \begin{tabular}{c|cc} & \multicolumn{3}{c}{ Dark } \\ My Farm Brown Brown Black \end{tabular} Revenue Per Acre \begin{tabular}{|c|c|c|c|} \hline Target Yield (Ib./ac.) (A) & 1,344.80 & 1,631.40 & 1,565.30 \\ \hline Estimated Farm Gate Price (\$/lb.) (B) & 0.49 & 0.49 & 0.49 \\ \hline Estimated Gross Revenue (\$/ac.) (AxB)=(C) & 658.95 & 799.39 & 767.00 \\ \hline \multicolumn{4}{|l|}{ Expenses Per Acre } \\ \hline \multicolumn{4}{|l|}{ Variable Expenses/Acre } \\ \hline Seed & 60.06 & 60.06 & 60.06 \\ \hline - Seed Treatments/Inoculants & 5.68 & 5.68 & 5.68 \\ \hline Fertilizer - Nitrogen (N) & 3.79 & 4.50 & 4.26 \\ \hline - Phosphorus (P2O5) & 13.78 & 16.54 & 15.62 \\ \hline - Sulphur (S) and Other & 0.00 & 0.00 & 0.00 \\ \hline \multirow[t]{3}{*}{ Plant Protection - Herbicides } & 56.16 & 56.16 & 74.00 \\ \hline & 15.34 & 15.34 & 15.34 \\ \hline & 19.70 & 19.70 & 19.70 \\ \hline \multirow{3}{*}{\begin{tabular}{l} Machinery Operating - Fuel \\ - Repair \\ Custom Work and Hired Labour \end{tabular}} & 21.32 & 26.65 & 33.31 \\ \hline & 10.27 & 11.59 & 13.11 \\ \hline & 22.25 & 21.50 & 23.25 \\ \hline Crop Insurance Premium & 12.13 & 14.37 & 12.44 \\ \hline Hail Insurance Premium & 12.25 & 12.25 & 12.25 \\ \hline Utilities and Miscellaneous & 3.23 & 4.23 & 4.89 \\ \hline Interest on Variable Expenses & 7.68 & 8.06 & 8.82 \\ \hline Total Variable Expenses (D) & 263.64 & 276.63 & 302.74 \\ \hline \multicolumn{4}{|l|}{ Other Expenses/Acre } \\ \hline Building Repair & 0.60 & 0.80 & 1.06 \\ \hline Property Taxes & 4.33 & 5.66 & 8.59 \\ \hline Business Overhead & 2.22 & 3.39 & 3.98 \\ \hline Machinery Depreciation & 42.28 & 47.68 & 53.96 \\ \hline Building Depreciation & 1.25 & 1.65 & 2.20 \\ \hline Machinery Investment & 16.30 & 18.38 & 20.80 \\ \hline Building Investment & 1.45 & 1.92 & 2.56 \\ \hline Land Investment & 130.38 & 149.90 & 140.14 \\ \hline Total Other Expenses (E) & 198.81 & 229.37 & 233.28 \\ \hline \multicolumn{4}{|l|}{ Labour and Management (F)} \\ \hline Total Expenses (D+E+F)=(G) & 462.45 & 506.00 & 536.02 \\ \hline \multicolumn{4}{|l|}{ReturnPerAcre} \\ \hline Return Over Variable Expenses (C-D) & 395.31 & 522.76 & 464.26 \\ \hline Return Over Total Expenses (C-G) & 196.50 & 293.39 & 230.98 \\ \hline \multicolumn{4}{|l|}{ Break Even Yield (lbs./ac.) } \\ \hline To Cover Variable Expenses & 538.05 & 564.55 & 617.83 \\ \hline To Cover Total Expenses & 943.78 & 1032.66 & 1093.91 \\ \hline \multicolumn{4}{|l|}{ Break Even Price (\$/lb.) } \\ \hline To Cover Variable Expenses & 0.20 & 0.17 & 0.19 \\ \hline To Cover Total Expenses & 0.34 & 0.31 & 0.34 \\ \hline \multicolumn{4}{|c|}{ Yield Sensitivity (same expenses, but average yield) } \\ \hline Provincial Average Yield (lb./ac.) & 1014.10 & 1278.70 & 1234.60 \\ \hline Return Over Variable Expenses & 233.27 & 349.93 & 302.21 \\ \hline Return Over Total Expenses & 34.46 & 120.56 & 68.93 \\ \hline \end{tabular} 2023 Hard Red Spring Wheat Economics My Farm Dark Brown Brown Black Revenue Per Acre \begin{tabular}{|l|c|c|c|} \hline Target Yield (bu./ac.) (A) & 44.1 & 53.3 & 62.5 \\ \hline Estimated Farm Gate Price (\$/bu.) (B) & 10.15 & 10.15 & 10.15 \\ \hline Estimated Gross Revenue (\$/ac.) (AxB)=(C) & 447.51 & 540.79 & 633.97 \\ \hline \end{tabular} Expenses Per Acre \begin{tabular}{|c|c|c|c|} \hline \multicolumn{4}{|l|}{ Variable Expenses/Acre } \\ \hline Seed & 24.96 & 27.52 & 31.04 \\ \hline - Seed Treatments/Inoculants & 5.75 & 6.34 & 7.15 \\ \hline Fertilizer - Nitrogen (N) & 86.40 & 104.16 & 121.91 \\ \hline - Phosphorus (P2O5) & 26.65 & 32.16 & 37.67 \\ \hline - Sulphur (S) and Other & 0.00 & 0.00 & 0.00 \\ \hline \multirow{2}{*}{ Plant Protection - } & 56.10 & 59.60 & 62.76 \\ \hline & 22.52 & 22.52 & 22.52 \\ \hline - Fungicides & 18.98 & 18.98 & 18.98 \\ \hline \multirow{2}{*}{ Machinery Operating - Fuel } & 19.08 & 23.85 & 29.81 \\ \hline & 10.27 & 11.59 & 13.11 \\ \hline Custom Work and Hired Labour & 22.75 & 22.50 & 23.50 \\ \hline Crop Insurance Premium & 5.05 & 4.60 & 4.78 \\ \hline Hail Insurance Premium & 12.25 & 12.25 & 12.25 \\ \hline Utilities and Miscellaneous & 3.23 & 4.23 & 4.89 \\ \hline Interest on Variable Expenses & 9.42 & 10.51 & 11.71 \\ \hline Total Variable Expenses (D) & 323.41 & 360.80 & 402.08 \\ \hline \multicolumn{4}{|l|}{ Other Expenses/Acre } \\ \hline Building Repair & 0.60 & 0.80 & 1.06 \\ \hline Property Taxes & 4.33 & 5.66 & 8.59 \\ \hline Business Overhead & 2.22 & 3.39 & 3.98 \\ \hline Machinery Depreciation & 42.28 & 47.68 & 53.96 \\ \hline Building Depreciation & 1.25 & 1.65 & 2.20 \\ \hline Machinery Investment & 16.30 & 18.38 & 20.80 \\ \hline Building Investment & 1.45 & 1.92 & 2.56 \\ \hline Land Investment & 130.38 & 149.90 & 140.14 \\ \hline Total Other Expenses (E) & 198.81 & 229.37 & 233.28 \\ \hline \multicolumn{4}{|l|}{ Labour and Management (F)} \\ \hline Total Expenses (D+E+F)=(G) & 522.21 & 590.17 & 635.36 \\ \hline \multicolumn{4}{|l|}{ Return Per Acre } \\ \hline Return Over Variable Expenses (C-D) & 124.10 & 179.99 & 231.89 \\ \hline Return Over Total Expenses (C-G) & -74.70 & -49.38 & -1.39 \\ \hline \multicolumn{4}{|l|}{ Break Even Yield (bu./ac.) } \\ \hline To Cover Variable Expenses & 31.86 & 35.55 & 39.61 \\ \hline To Cover Total Expenses & 51.45 & 58.15 & 62.60 \\ \hline \multicolumn{4}{|l|}{ Break Even Price (\$/bu.) } \\ \hline To Cover Variable Expenses & 7.34 & 6.77 & 6.44 \\ \hline To Cover Total Expenses & 11.84 & 11.08 & 10.17 \\ \hline \multicolumn{4}{|c|}{ Yield Sensitivity (same expenses, but average yield) } \\ \hline Provincial Average Yield (bu./ac.) & 34.54 & 44.46 & 53.28 \\ \hline Return Over Variable Expenses & 27.17 & 90.47 & 138.71 \\ \hline Return Over Total Expenses & -171.63 & -138.90 & -94.57 \\ \hline \end{tabular} 2023 Canola Economics My Farm Dark Brown Brown Black Revenue Per Acre \begin{tabular}{|c|c|c|c|} \hline Target Yield (bu./ac.) (A) & 36.16 & 42.77 & 48.06 \\ \hline Estimated Farm Gate Price (\$/bu.) (B) & 17.61 & 17.61 & 17.61 \\ \hline Estimated Gross Revenue ($/ac).(AxB)=(C) & 636.78 & 753.18 & 846.34 \\ \hline \multicolumn{4}{|l|}{ Expenses Per Acre } \\ \hline \multicolumn{4}{|l|}{ Variable Expenses/Acre } \\ \hline Seed & 79.75 & 79.75 & 79.75 \\ \hline - Seed Treatments/Inoculants & 9.00 & 9.00 & 9.00 \\ \hline Fertilizer - Nitrogen (N) & 89.96 & 106.53 & 120.73 \\ \hline - Phosphorus (P2O5) & 37.67 & 45.02 & 50.54 \\ \hline - Sulphur (S) and Other & 4.77 & 5.96 & 6.56 \\ \hline Plant Protection - Herbicides & 66.93 & 66.93 & 76.32 \\ \hline - Insecticides & 2.78 & 2.78 & 2.78 \\ \hline - Fungicides & 0.00 & 14.63 & 14.63 \\ \hline Machinery Operating - Fuel & 20.20 & 25.25 & 31.56 \\ \hline - Repair & 10.27 & 11.59 & 13.11 \\ \hline Custom Work and Hired Labour & 21.50 & 21.50 & 21.50 \\ \hline Crop Insurance Premium & 13.11 & 10.51 & 10.97 \\ \hline Hail Insurance Premium & 12.25 & 12.25 & 12.25 \\ \hline Utilities and Miscellaneous & 3.23 & 4.23 & 4.89 \\ \hline Interest on Variable Expenses & 11.14 & 12.48 & 13.64 \\ \hline Total Variable Expenses (D) & 382.56 & 428.41 & 468.22 \\ \hline \multicolumn{4}{|l|}{ Other Expenses/Acre } \\ \hline Building Repair & 0.60 & 0.80 & 1.06 \\ \hline Property Taxes & 4.33 & 5.66 & 8.59 \\ \hline Business Overhead & 2.22 & 3.39 & 3.98 \\ \hline Machinery Depreciation & 42.28 & 47.68 & 53.96 \\ \hline Building Depreciation & 1.25 & 1.65 & 2.20 \\ \hline Machinery Investment & 16.30 & 18.38 & 20.80 \\ \hline Building Investment & 1.45 & 1.92 & 2.56 \\ \hline Land Investment & 130.38 & 149.90 & 140.14 \\ \hline Total Other Expenses (E) & 198.81 & 229.37 & 233.28 \\ \hline \multicolumn{4}{|l|}{ Labour and Management (F)} \\ \hline Total Expenses (D+E+F)=(G) & 581.36 & 657.78 & 701.50 \\ \hline \multicolumn{4}{|l|}{ Return Per Acre } \\ \hline Return Over Variable Expenses (C-D) & 254.22 & 324.77 & 378.12 \\ \hline Return Over Total Expenses (C-G) & 55.42 & 95.40 & 144.84 \\ \hline \multicolumn{4}{|l|}{ Break Even Yield (bu./ac.) } \\ \hline To Cover Variable Expenses & 21.72 & 24.33 & 26.59 \\ \hline To Cover Total Expenses & 33.01 & 37.35 & 39.84 \\ \hline \multicolumn{4}{|l|}{ Break Even Price (\$/bu.) } \\ \hline To Cover Variable Expenses & 10.58 & 10.02 & 9.74 \\ \hline To Cover Total Expenses & 16.08 & 15.38 & 14.60 \\ \hline \multicolumn{4}{|c|}{ Yield Sensitivity (same expenses, but average yield) } \\ \hline Provincial Average Yield (bu./ac.) & 29.10 & 35.27 & 41.45 \\ \hline Return Over Variable Expenses & 129.89 & 192.69 & 261.71 \\ \hline Return Over Total Expenses & -68.91 & -36.68 & 28.43 \\ \hline \end{tabular} 2023 Durum Wheat Economics \begin{tabular}{c|cc} & \multicolumn{1}{c}{ Dark } \\ My Farm & Brown & Brown \end{tabular} Revenue Per Acre \begin{tabular}{|l|c|c|} \hline Target Yield (bu./ac.) (A) & 41.5 & 53.7 \\ \hline Estimated Farm Gate Price (\$/bu.) (B) & 12.03 & 12.03 \\ \hline Estimated Gross Revenue (\$/ac.) (AxB)=(C) & 499.49 & 645.41 \\ \hline \end{tabular} Expenses Per Acre \begin{tabular}{|c|c|c|} \hline \multicolumn{3}{|l|}{ Variable Expenses/Acre } \\ \hline Seed & 31.35 & 34.32 \\ \hline - Seed Treatments/Inoculants & 7.00 & 7.67 \\ \hline Fertilizer - Nitrogen (N) & 81.67 & 105.34 \\ \hline - Phosphorus (P2O5) & 24.81 & 32.16 \\ \hline - Sulphur (S) and Other & 0.00 & 0.00 \\ \hline Plant Protection - Herbicides & 16.47 & 16.47 \\ \hline - Insecticides & 22.52 & 22.52 \\ \hline - Fungicides & 18.98 & 18.98 \\ \hline \begin{array}{l} Machinery Operating - Fuel \\ - Repair \end{array} & 19.08 & 23.85 \\ \hline - Repair & 10.27 & 11.59 \\ \hline Custom Work and Hired Labour & 22.75 & 22.50 \\ \hline Crop Insurance Premium & 7.01 & 8.62 \\ \hline Hail Insurance Premium & 12.25 & 12.25 \\ \hline Utilities and Miscellaneous & 3.23 & 4.23 \\ \hline Interest on Variable Expenses & 8.32 & 9.61 \\ \hline Total Variable Expenses (D) & 285.71 & 330.10 \\ \hline \multicolumn{3}{|l|}{ Other Expenses/Acre } \\ \hline Building Repair & 0.60 & 0.80 \\ \hline Property Taxes & 4.33 & 5.66 \\ \hline Business Overhead & 2.22 & 3.39 \\ \hline Machinery Depreciation & 42.28 & 47.68 \\ \hline Building Depreciation & 1.25 & 1.65 \\ \hline Machinery Investment & 16.30 & 18.38 \\ \hline Building Investment & 1.45 & 1.92 \\ \hline Land Investment & 130.38 & 149.90 \\ \hline Total Other Expenses (E) & 198.81 & 229.37 \\ \hline \multicolumn{3}{|l|}{ Labour and Management (F)} \\ \hline Total Expenses (D+E+F)=(G) & 484.51 & 559.48 \\ \hline \multicolumn{3}{|l|}{ReturnPerAcre} \\ \hline Return Over Variable Expenses (C-D) & 213.78 & 315.31 \\ \hline Return Over Total Expenses (C-G) & 14.98 & 85.93 \\ \hline \multicolumn{3}{|l|}{ Break Even Yield (bu./ac.) } \\ \hline To Cover Variable Expenses & 23.75 & 27.44 \\ \hline To Cover Total Expenses & 40.28 & 46.51 \\ \hline Break Even Price(\$/bu.) & & \\ \hline To Cover Variable Expenses & 6.88 & 6.15 \\ \hline To Cover Total Expenses & 11.67 & 10.43 \\ \hline Yield Sensitivity (same expens & ge yield & \\ \hline Provincial Average Yield (bu./ac.) & 32.33 & 43.73 \\ \hline Return Over Variable Expenses & 103.22 & 195.97 \\ \hline Return Over Total Expenses & -95.58 & -33.41 \\ \hline \end{tabular}Step by Step Solution
There are 3 Steps involved in it
Step: 1

Get Instant Access to Expert-Tailored Solutions
See step-by-step solutions with expert insights and AI powered tools for academic success
Step: 2

Step: 3

Ace Your Homework with AI
Get the answers you need in no time with our AI-driven, step-by-step assistance
Get Started


