Answered step by step
Verified Expert Solution
Link Copied!

Question

1 Approved Answer

Imagine you work for an automobile insurance company. You are assigned the task of reviewing recent auto safety records and thinking about how that information

Imagine you work for an automobile insurance company. You are assigned the task of reviewing recent auto safety records and thinking about how that information may be relevant to your company. You find the data below:

Vehicles with poor safety ratings should correlate with higher insurance premiums to be paid by customers.

Create a report for your company that includes each of the following: Appropriate comparative plots and summary statistics. (For each "class" of vehicle, find a 5 number summary and create an appropriate boxplot.

Your boxplots can be done by hand or on statistical software.)

Descriptions of the injury ratings for each class of car. (Descriptions of shape, center, and spread of each class. A histogram may be beneficial, but not required)

A comparison of injury ratings between the 3 classes of car. (What class is the safest? The most dangerous? A recommendation of insurance premiums to be paid by customers, by class, from least expensive to most expensive.
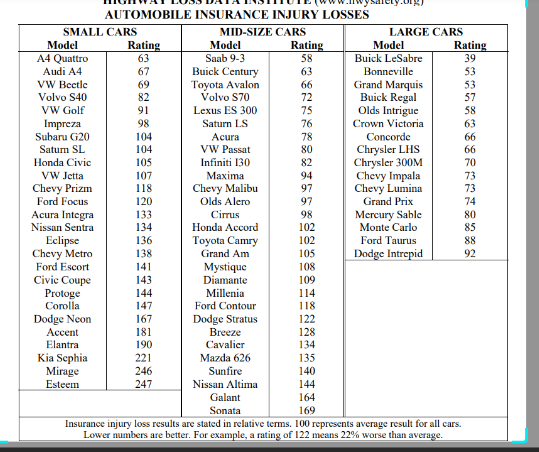
image text in transcribed
AUTOMOBILE INSURANCE INJURY LOSSES SMALL CARS MID-SIZE CARS LARGE CARS Model Rating Model Rating Model Rating A4 Quattro 63 Saab 9-3 58 Buick Lesabre 39 Audi A4 67 Buick Century 63 Bonneville 53 VW Beetle 69 Toyota Avalon 66 Grand Marquis 53 Volvo S40 82 Volvo $70 72 Buick Regal 57 VW Golf 91 Lexus ES 300 75 Olds Intrigue 58 Impreza 98 Saturn LS 76 Crown Victoria 63 Subaru G20 104 Acura 78 Concorde Saturn SL 104 VW Passat 80 Chrysler LHS 66 Honda Civic 105 Infiniti 130 82 Chrysler 300M 70 VW Jetta 107 Maxima 94 Chevy Impala 73 Chevy Prizm 118 Chevy Malibu 97 Chevy Lumina 73 Ford Focus 120 Olds Alero 97 Grand Prix 74 Acura Integra 133 Cirrus 98 Mercury Sable 80 Nissan Sentra 134 Honda Accord 102 Monte Carlo 85 Eclipse 136 Toyota Camry 102 Ford Taurus 88 Chevy Metro 138 Grand Am 105 Dodge Intrepid 92 Ford Escort 141 Mystique 108 Civic Coupe 143 Diamante 109 Protoge 144 Millenia 114 Corolla 147 Ford Contour 118 Dodge Neon 167 Dodge Stratus 122 Accent 181 Breeze 128 Elantra 190 Cavalier 134 Kia Sephia 221 Mazda 626 135 Mirage 246 Sunfire 140 Esteem 247 Nissan Altima 144 Galant 164 Sonata 169 Insurance injury loss results are stated in relative terms. 100 represents average result for all cars. Lower numbers are better. For example, a rating of 122 means 22% worse than average

Step by Step Solution

There are 3 Steps involved in it

Step: 1

blur-text-image

Get Instant Access to Expert-Tailored Solutions

See step-by-step solutions with expert insights and AI powered tools for academic success

Step: 2

blur-text-image

Step: 3

blur-text-image

Ace Your Homework with AI

Get the answers you need in no time with our AI-driven, step-by-step assistance

Get Started

Recommended Textbook for

Probability and Stochastic Processes A Friendly Introduction for Electrical and Computer Engineers

Authors: Roy D. Yates, David J. Goodman

3rd edition

1118324560, 978-1118324561

More Books

Students also viewed these Mathematics questions