

Answered step by step
Verified Expert Solution
Question
1 Approved Answer
imaging lab Objective: The purpose of this experiment is to understand the principle of mixing of colors and how it is accomplished in different displays
imaging lab 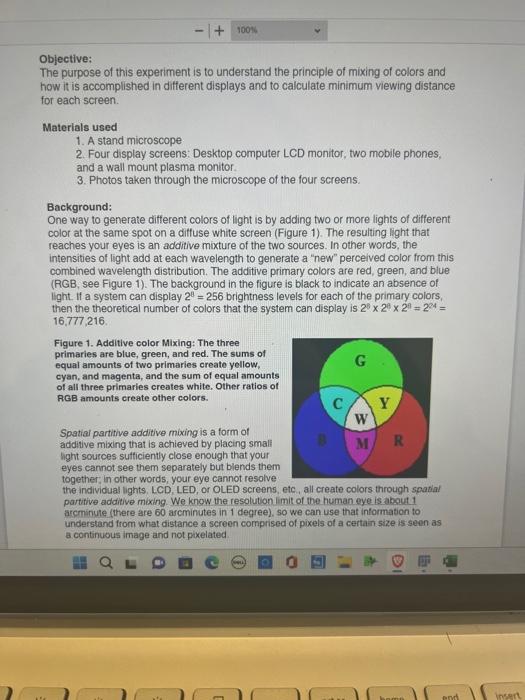
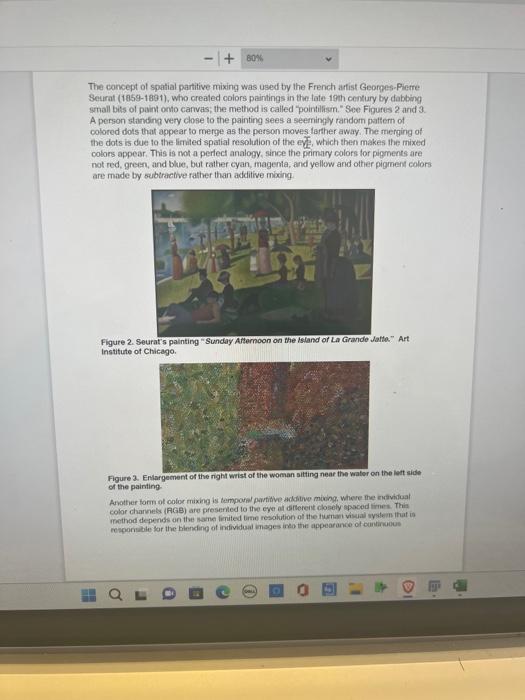
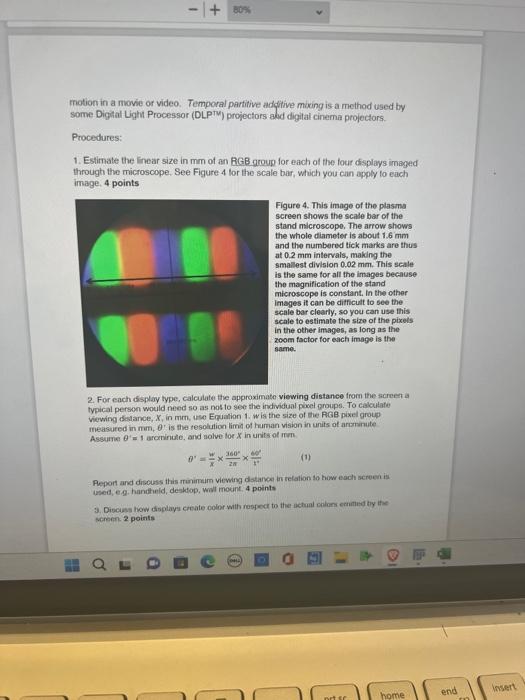


Objective: The purpose of this experiment is to understand the principle of mixing of colors and how it is accomplished in different displays and to calculate minimum viewing distance for each screen. Materials used 1. A stand microscope 2. Four display screens: Desktop computer LCD monitor, two mobile phones, and a wall mount plasma monitor. 3. Photos taken through the microscope of the four screens. Background: One way to generate different colors of light is by adding two or more lights of different color at the same spot on a diffuse white screen (Figure 1). The resulting light that reaches your eyes is an additive mixture of the two sources. In other words, the intensities of light add at each wavelength to generate a "new" perceived color from this combined wavelength distribution. The additive primary colors are red, green, and blue (RGB, see Figure 1). The background in the figure is black to indicate an absence of light. If a system can display 2t=256 brightness levels for each of the primary colors, then the theoretical number of colors that the system can display is 2628629=224= 16,777,216. Figure 1. Additive color Mixing: The three primaries are blue, green, and red. The sums of equal amounts of two primaries create yollow, cyan, and magenta, and the sum of equal amounts of all three primaries creates white. Other ratios of AGB amounts create other colors. Spatial partitive additive mixing is a form of additive mixing that is achieved by placing small hight sources sutticiently close enough that your eyes cannot see them separately but blends them together: in other words, your eye cannot resolve the individual lights, LCD, LED, or OLED screens, etc, all create colors through spatial partitive additive mixing. We know the resolution imit of the human eye is about 1 arcminute (there are 60 arcminutes in 1 degree), so we can use that information to understand from what distance a screen comprised of pixels of a certain size is seen as a continuous image and not pixelated. The concept of spatial partitive mixing was used by the French arfist Georges. Pietre Seurat (1859-1891), who created colors paintings in the fate 19 th century by dabbing small bits of paint onto carvas; the method is called pointilism." See Figures 2 and 3. A person standing very close to the painting sees a seemingly random pattem of colored dols that appear to merge as the person moves tarther away. The merging of the dots is due to the limnted spatial resolution of the eve, which then makes the mixed colors appear. This is not a perfect analogy, since the primary colors for pigments are not red, green, and blue, but rather cyan, magenta, and yellow and otter pignent colors are made by bubtractive rather than additive mixing Figure 2. Seurat's painting "Sunday Attemoon on the istand of La Grande Jatta" Aft Institute of Chicago. Figure 2. Eniargement of the right wrist of the woman sitting near tive water on the lett side of the painting. Aswother forn of color mixing is temporal partitive additive miving, where the evividual color charnets (AGB) are presented to the eye di diterent ciosely spaced lirmers. Thir mothod depends on the same lenited birne resolution of the tiestian visual ovstem that is responsible tor the hiending of inifividual insges ineo the appearance of olintindous motion in a movie or video. Temporal partitive additive maing is a method used by some Digital Uight Processor (DLPTM) projectors alud digital cinema projectors. Procedures: 1. Estimate the linear size in mm of an RGB groun for each of the four displays imaged through the microscope. See Figure 4 tor the scale bar, which you can opply to each image, 4 points Figure 4. This image of the plasma screen shows the scale bar of the stand microscope, The arrow shows the whole diamoter is about 1.6mm and the numbered tick marks are thus at 0.2mm intervals, making the smallest division 0.02mm. This scale is the same for all the images becaluse the magnification of the stand microscope is constant, In the other Imeges it can be ditficutt to see the scale bar clearly, so you can use this in the other images, as long as the zoom factor for each image is the same. 2. For each dsplay type, calculate the approximate viewing distance from the screen a typical person would need so as not to see the individual powel groups. To calculate viewing dislance, X, in mm, twe Equation 1. wis the size of the AGB pixel group measured in mm, , is the resolution limit of taman vision in units of arranute Assume =1 arcininule, and nolve tor X in units of imm =xw2300w40 Peport and discouss this minimaim viewing datankel in relation to how each screen is issed, eg hantheid, desktop, woll mount. 4 points 3. Divouss how displays create color with rosped to the nctual collors emitied tiy the mereen: 2 points nt edu/dzulefontent/9g9670MiewContent/8371474/iew Print Illmount Plasma Objective: The purpose of this experiment is to understand the principle of mixing of colors and how it is accomplished in different displays and to calculate minimum viewing distance for each screen. Materials used 1. A stand microscope 2. Four display screens: Desktop computer LCD monitor, two mobile phones, and a wall mount plasma monitor. 3. Photos taken through the microscope of the four screens. Background: One way to generate different colors of light is by adding two or more lights of different color at the same spot on a diffuse white screen (Figure 1). The resulting light that reaches your eyes is an additive mixture of the two sources. In other words, the intensities of light add at each wavelength to generate a "new" perceived color from this combined wavelength distribution. The additive primary colors are red, green, and blue (RGB, see Figure 1). The background in the figure is black to indicate an absence of light. If a system can display 2t=256 brightness levels for each of the primary colors, then the theoretical number of colors that the system can display is 2628629=224= 16,777,216. Figure 1. Additive color Mixing: The three primaries are blue, green, and red. The sums of equal amounts of two primaries create yollow, cyan, and magenta, and the sum of equal amounts of all three primaries creates white. Other ratios of AGB amounts create other colors. Spatial partitive additive mixing is a form of additive mixing that is achieved by placing small hight sources sutticiently close enough that your eyes cannot see them separately but blends them together: in other words, your eye cannot resolve the individual lights, LCD, LED, or OLED screens, etc, all create colors through spatial partitive additive mixing. We know the resolution imit of the human eye is about 1 arcminute (there are 60 arcminutes in 1 degree), so we can use that information to understand from what distance a screen comprised of pixels of a certain size is seen as a continuous image and not pixelated. The concept of spatial partitive mixing was used by the French arfist Georges. Pietre Seurat (1859-1891), who created colors paintings in the fate 19 th century by dabbing small bits of paint onto carvas; the method is called pointilism." See Figures 2 and 3. A person standing very close to the painting sees a seemingly random pattem of colored dols that appear to merge as the person moves tarther away. The merging of the dots is due to the limnted spatial resolution of the eve, which then makes the mixed colors appear. This is not a perfect analogy, since the primary colors for pigments are not red, green, and blue, but rather cyan, magenta, and yellow and otter pignent colors are made by bubtractive rather than additive mixing Figure 2. Seurat's painting "Sunday Attemoon on the istand of La Grande Jatta" Aft Institute of Chicago. Figure 2. Eniargement of the right wrist of the woman sitting near tive water on the lett side of the painting. Aswother forn of color mixing is temporal partitive additive miving, where the evividual color charnets (AGB) are presented to the eye di diterent ciosely spaced lirmers. Thir mothod depends on the same lenited birne resolution of the tiestian visual ovstem that is responsible tor the hiending of inifividual insges ineo the appearance of olintindous motion in a movie or video. Temporal partitive additive maing is a method used by some Digital Uight Processor (DLPTM) projectors alud digital cinema projectors. Procedures: 1. Estimate the linear size in mm of an RGB groun for each of the four displays imaged through the microscope. See Figure 4 tor the scale bar, which you can opply to each image, 4 points Figure 4. This image of the plasma screen shows the scale bar of the stand microscope, The arrow shows the whole diamoter is about 1.6mm and the numbered tick marks are thus at 0.2mm intervals, making the smallest division 0.02mm. This scale is the same for all the images becaluse the magnification of the stand microscope is constant, In the other Imeges it can be ditficutt to see the scale bar clearly, so you can use this in the other images, as long as the zoom factor for each image is the same. 2. For each dsplay type, calculate the approximate viewing distance from the screen a typical person would need so as not to see the individual powel groups. To calculate viewing dislance, X, in mm, twe Equation 1. wis the size of the AGB pixel group measured in mm, , is the resolution limit of taman vision in units of arranute Assume =1 arcininule, and nolve tor X in units of imm =xw2300w40 Peport and discouss this minimaim viewing datankel in relation to how each screen is issed, eg hantheid, desktop, woll mount. 4 points 3. Divouss how displays create color with rosped to the nctual collors emitied tiy the mereen: 2 points nt edu/dzulefontent/9g9670MiewContent/8371474/iew Print Illmount Plasma Step by Step Solution
There are 3 Steps involved in it
Step: 1

Get Instant Access to Expert-Tailored Solutions
See step-by-step solutions with expert insights and AI powered tools for academic success
Step: 2

Step: 3
Ace Your Homework with AI
Get the answers you need in no time with our AI-driven, step-by-step assistance
Get Started
Auditing Investments
Authors: Barbara Davison
1st Edition
0894134272, 978-0894134272