

Question
Imaging objects in classes A and B having two numeric attributes/properties that we map to X and Y Cartesian coordinates so that we can plot
Imaging objects in classes A and B having two numeric attributes/properties that we map to X and Y Cartesian coordinates so that we can plot class instances (cases) as points on a 2-D chart. In other words, our cases are represented as points with X and Y coordinates (p(X,Y)).
Our simple classes A and B will have 3 object instances (cases) each.
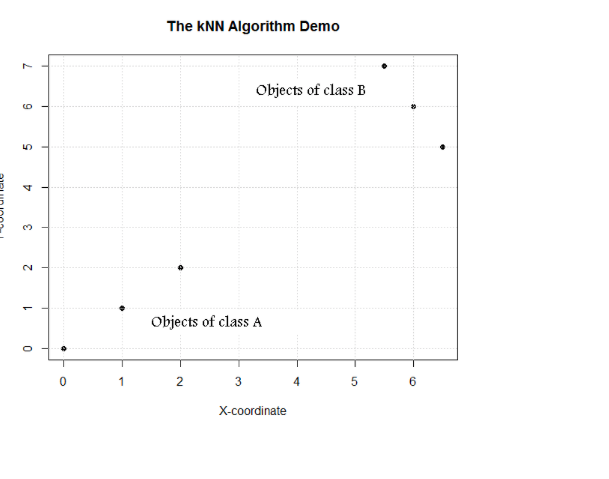
Class A will include points with coordinates (0,0), (1,1), and (2,2). Class B will include points with coordinates (6,6), (5.5, 7), and (6.5, 5).
In R software , we can write down the above arrangement as follows:
# Class A training object instances (cases) A1=c(0,0) A2=c(1,1) A3=c(2,2) # Class B training objects instances (cases) B1=c(6,6) B2=c(5.5,7) B3=c(6.5,5)
How are the classification training objects for class A and class B arranged on a chart?
Print the chart
Please help, I don't know how to start
below is how the chart should look like
Step by Step Solution
There are 3 Steps involved in it
Step: 1

Get Instant Access to Expert-Tailored Solutions
See step-by-step solutions with expert insights and AI powered tools for academic success
Step: 2

Step: 3
Ace Your Homework with AI
Get the answers you need in no time with our AI-driven, step-by-step assistance
Get Started
Databases A Beginners Guide
Authors: Andy Oppel
1st Edition
007160846X, 978-0071608466