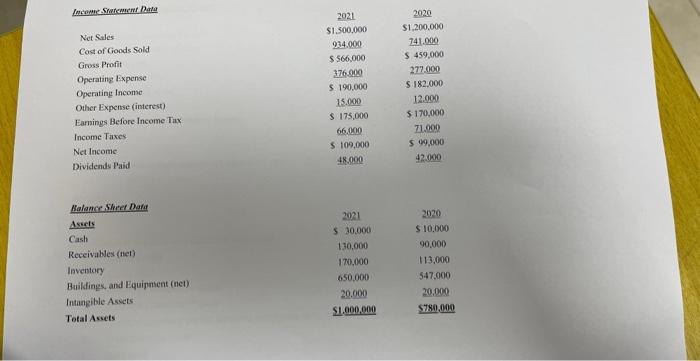
Imcome Soutenerent Detar Net Sales. Cast of Gioods sold Gross Profit Operating lixpense Operating Income Other Expense (interest) Earaings Before Income Tax Income Taxes. Net Income: Dividends Paind 2021$1.500,000934.000$566,000376.000$190.00015.000$175,00066.000$109,00048.0002020$1,200,000741.000$459,000277.000$182.00012.000$170.00071.000$99,00042.000 Nalance Sherer Data Asects Cash Receivables (thet) Inventory Buildings, and Equipment (net) Intangible Assets Total Assets \begin{tabular}{cc} 2021 & 2020 \\ 530.000 & $10.000 \\ 130,000 & 90,000 \\ 170,000 & 113,000 \\ 650.000 & 547,000 \\ 20.000 & 20,000 \\ $1.000,000 & $780.000 \\ \hline \end{tabular} Note: Market price of suck end-of-each year: 581$65 Revuinalf Required: a Campute the following ratios for both yoars 1. Current ratio 2. Quick ratio 3. Inventory turthover in days 4. Average Collection Period 5. Average payment period (assume purchases 60\% of sale for each yeat) 6. Total asset turnowor 7. Debt ratio 8. Debt to equity ratio 0. Gross Profit margin 10. Operating Profit Margin 11. Net profit margin 12. Retum on assets 13. Retum on equity b. Describe the firm's profitability trend based on data of last two years. Appendix: 1. Current mato =CA/Cl. 2. Quick ratio = (CA-laveniory) /Cl. 3. Imeateoy turmaver - COGS / Inventory 4. Insentory turnower in das - 365 / Inventory tumover 5. Average collection period =AR/ (Sales 365) 6. Averese payment period - Prayable (Purchasev365) 7. Total asset tumover = Seles / Total Assets 8. Deta ratio - Tetal liahilities Jotal Ascets. 9. Debt to Equity Ratio - Total Liabilibies Y Common sack oquity 10. Gross Operating Maryin - Sales - COGS SALHS: 11. Operating Profit Martin = Operating Profiesales 12. Net profit maryin = Earninus available for commen stockholderisales 13. Return on Assets - Earmings availahle for cemanson stockholdeny Total Asels. 14. Reium on Equity = Eamings available for common stockholdern Consnon Stock Equity