Answered step by step
Verified Expert Solution
Question
1 Approved Answer
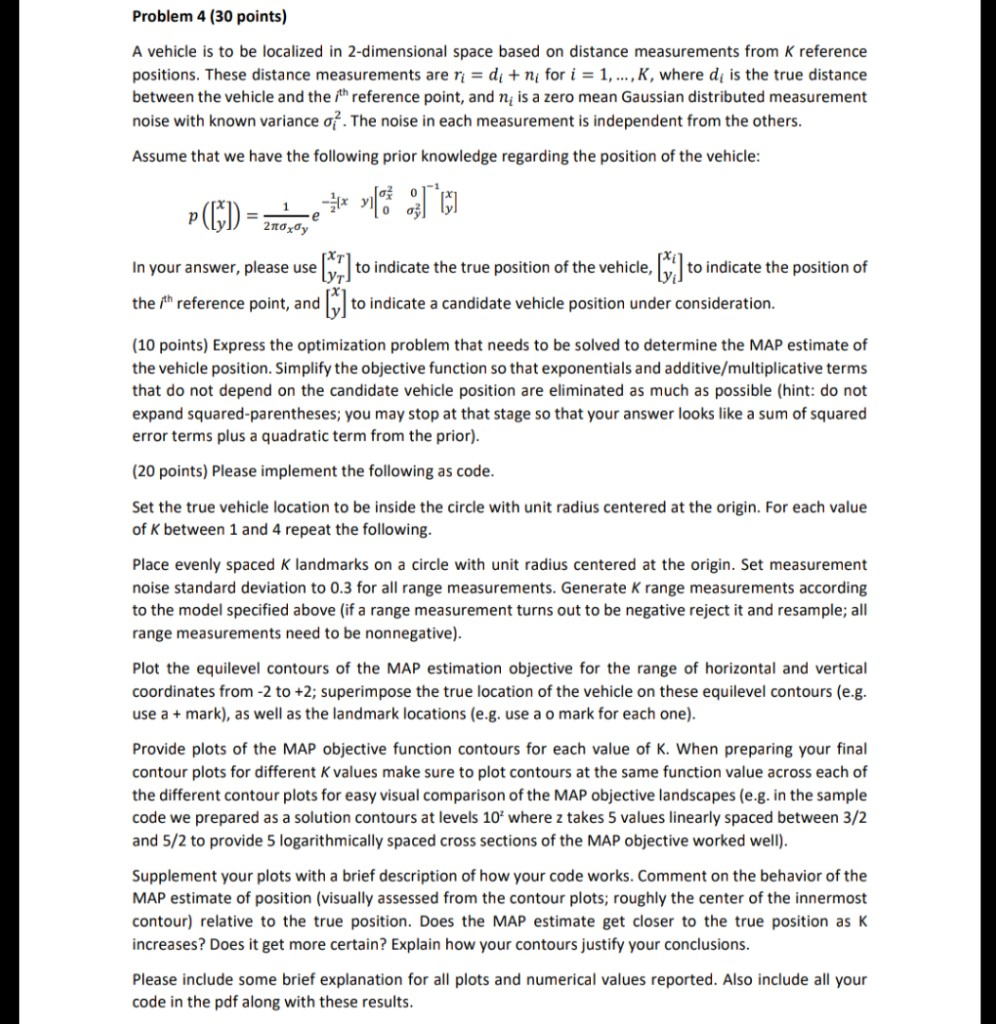
Implement the following as code section in MATLAB Problem 4 (30 points) A vehicle is to be localized in 2-dimensional space based on distance measurements

Implement the following as code section in MATLAB
Problem 4 (30 points) A vehicle is to be localized in 2-dimensional space based on distance measurements from K reference positions. These distance measurements are di + ni for 1-1, , K, where di is the true distance between the vehicle and the ith reference point, and n is a zero mean Gaussian distributed measurement noise with known variance i. The noise in each measurement is independent from the others Assume that we have the following prior knowledge regarding the position of the vehicle 0 In your answer,pea se to indicate the true position of the vehicle,vto indicate the position of the ith reference point, andto indicate a candidate vehicle position under consideration. (10 points) Express the optimization problem that needs to be solved to determine the MAP estimate of the vehicle position. Simplify the objective function so that exponentials and additive/multiplicative terms that do not depend on the candidate vehicle position are eliminated as much as possible (hint: do not expand squared-parentheses; you may stop at that stage so that your answer looks like a sum of squared error terms plus a quadratic term from the prior) (20 points) Please implement the following as code Set the true vehicle location to be inside the circle with unit radius centered at the origin. For each value of K between 1 and 4 repeat the following Place evenly spaced K landmarks on a circle with unit radius centered at the origin. Set measurement noise standard deviation to 0.3 for all range measurements. Generate K range measurements according to the model specified above (if a range measurement turns out to be negative reject it and resample; all range measurements need to be nonnegative) Plot the equilevel contours of the MAP estimation objective for the range of horizontal and vertical coordinates from -2 to +2; superimpose the true location of the vehicle on these equilevel contours (e.g use a mark), as well as the landmark locations (e.g. use a o mark for each one) Provide plots of the MAP objective function contours for each value of K. When preparing your final contour plots for different K values make sure to plot contours at the same function value across each of the different contour plots for easy visual comparison of the MAP objective landscapes (e.g. in the sample code we prepared as a solution contours at levels 10 where z takes 5 values linearly spaced between 3/2 and 5/2 to provide 5 logarithmically spaced cross sections of the MAP objective worked well) Supplement your plots with a brief description of how your code works. Comment on the behavior of the MAP estimate of position (visually assessed from the contour plots; roughly the center of the innermost contour) relative to the true position. Does the MAP estimate get closer to the true position as K increases? Does it get more certain? Explain how your contours justify your conclusions. Please include some brief explanation for all plots and numerical values reported. Also include all your code in the pdf along with these results Problem 4 (30 points) A vehicle is to be localized in 2-dimensional space based on distance measurements from K reference positions. These distance measurements are di + ni for 1-1, , K, where di is the true distance between the vehicle and the ith reference point, and n is a zero mean Gaussian distributed measurement noise with known variance i. The noise in each measurement is independent from the others Assume that we have the following prior knowledge regarding the position of the vehicle 0 In your answer,pea se to indicate the true position of the vehicle,vto indicate the position of the ith reference point, andto indicate a candidate vehicle position under consideration. (10 points) Express the optimization problem that needs to be solved to determine the MAP estimate of the vehicle position. Simplify the objective function so that exponentials and additive/multiplicative terms that do not depend on the candidate vehicle position are eliminated as much as possible (hint: do not expand squared-parentheses; you may stop at that stage so that your answer looks like a sum of squared error terms plus a quadratic term from the prior) (20 points) Please implement the following as code Set the true vehicle location to be inside the circle with unit radius centered at the origin. For each value of K between 1 and 4 repeat the following Place evenly spaced K landmarks on a circle with unit radius centered at the origin. Set measurement noise standard deviation to 0.3 for all range measurements. Generate K range measurements according to the model specified above (if a range measurement turns out to be negative reject it and resample; all range measurements need to be nonnegative) Plot the equilevel contours of the MAP estimation objective for the range of horizontal and vertical coordinates from -2 to +2; superimpose the true location of the vehicle on these equilevel contours (e.g use a mark), as well as the landmark locations (e.g. use a o mark for each one) Provide plots of the MAP objective function contours for each value of K. When preparing your final contour plots for different K values make sure to plot contours at the same function value across each of the different contour plots for easy visual comparison of the MAP objective landscapes (e.g. in the sample code we prepared as a solution contours at levels 10 where z takes 5 values linearly spaced between 3/2 and 5/2 to provide 5 logarithmically spaced cross sections of the MAP objective worked well) Supplement your plots with a brief description of how your code works. Comment on the behavior of the MAP estimate of position (visually assessed from the contour plots; roughly the center of the innermost contour) relative to the true position. Does the MAP estimate get closer to the true position as K increases? Does it get more certain? Explain how your contours justify your conclusions. Please include some brief explanation for all plots and numerical values reported. Also include all your code in the pdf along with these resultsStep by Step Solution
There are 3 Steps involved in it
Step: 1

Get Instant Access to Expert-Tailored Solutions
See step-by-step solutions with expert insights and AI powered tools for academic success
Step: 2

Step: 3

Ace Your Homework with AI
Get the answers you need in no time with our AI-driven, step-by-step assistance
Get Started


