Answered step by step
Verified Expert Solution
Question
1 Approved Answer
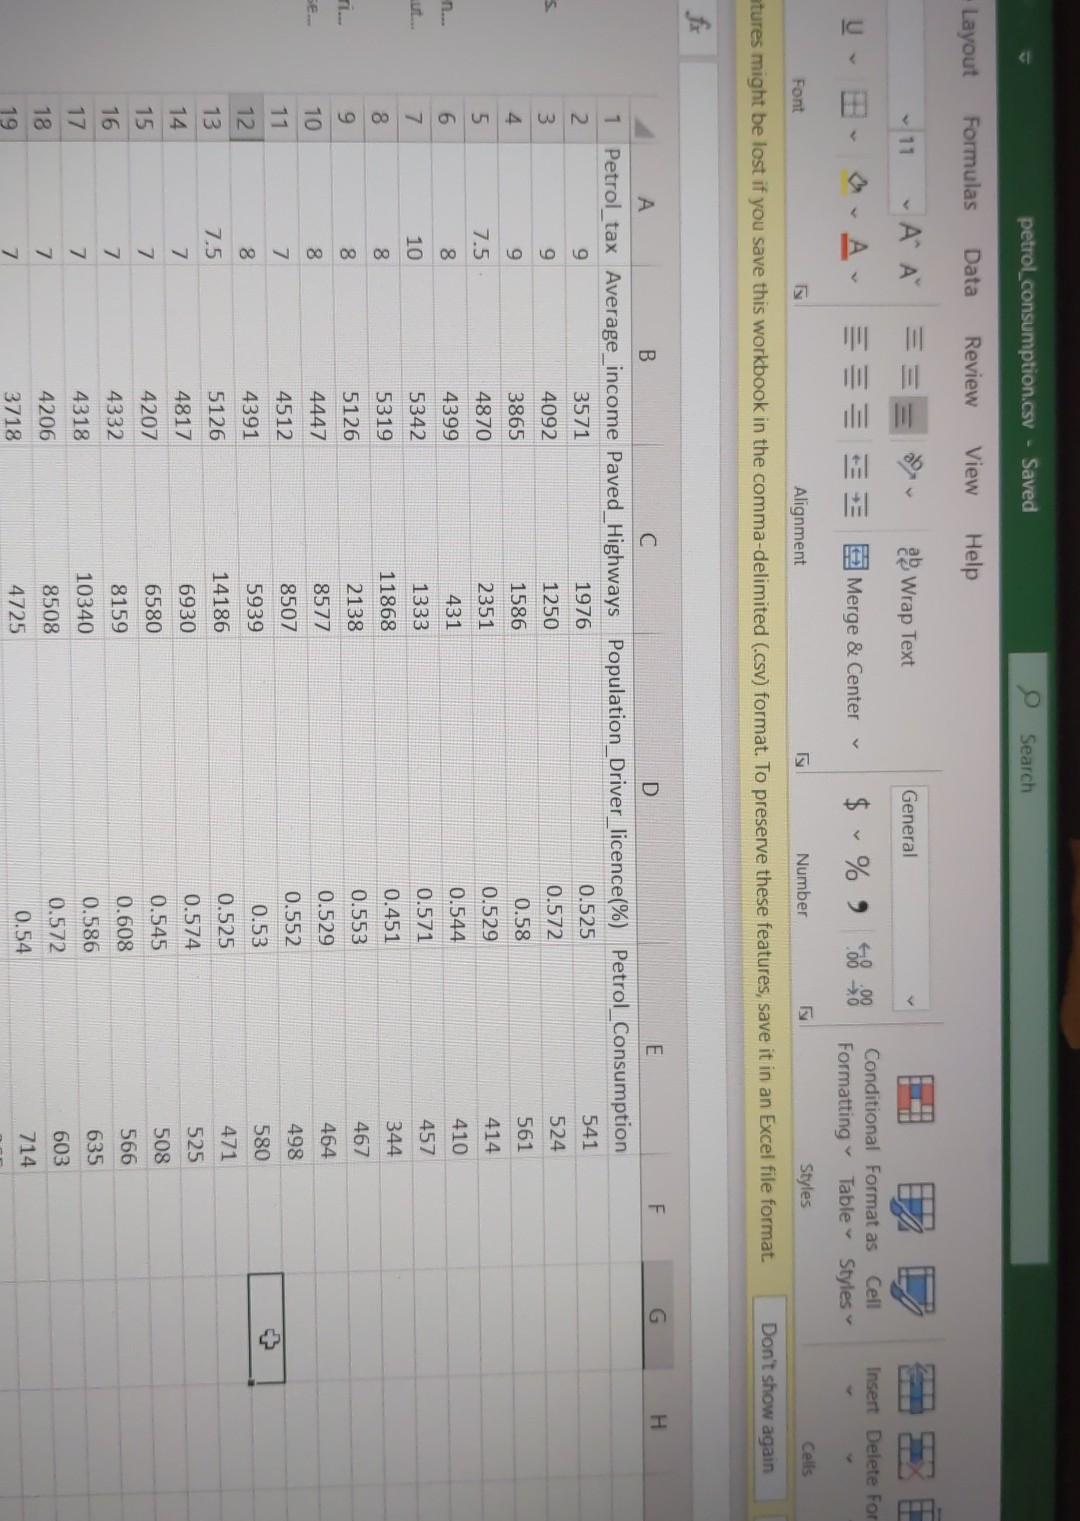
Implement the multivariable linear regression for the attached petrol_consumption dataset (CSV file). The last column is the output. 80% of the dataset is used for
Implement the multivariable linear regression for the attached petrol_consumption dataset (CSV file). The last column is the output. 80% of the dataset is used for training and 20% is used for testing. Output the prediction results.(Note: Use tool python3/jupiter notebook) .

petrol consumption.csv - Saved Search Layout Formulas Data Review View Help 11 ' a Wrap Text General Insert Delete For Merge & Center $ %, 0 Conditional Format as Cell Formatting Table Styles Font Cells Number Alignment Styles Don't show again atures might be lost if you save this workbook in the comma-delimited (.csv) format. To preserve these features, save it in an Excel file format F H 5 A B. C E 1 Petrol_tax Average_income Paved_Highways Population_Driver_licence(%) Petrol_Consumption 2 9 3571 1976 0.525 541 3 9 4092 1250 0.572 524 4 9 3865 1586 0.58 561 5 7.5 4870 2351 0.529 414 6 8 4399 431 0.544 410 7 10 5342 1333 0.571 457 8 8. 5319 11868 0.451 344 9 8. 5126 2138 0.553 467 10 8. 4447 8577 0.529 464 11 7 4512 8507 0.552 498 12 8 4391 580 5939 0.53 13 5126 7.5 471 14186 0.525 14 7 4817 6930 525 0.574 15 7 4207 6580 508 0.545 16 7 4332 566 0.608 8159 7 17 4318 10340 635 0.586 18 603 7 4206 8508 0.572 19 714 7 4725 3718 0.54 SE $
Step by Step Solution
There are 3 Steps involved in it
Step: 1

Get Instant Access to Expert-Tailored Solutions
See step-by-step solutions with expert insights and AI powered tools for academic success
Step: 2

Step: 3

Ace Your Homework with AI
Get the answers you need in no time with our AI-driven, step-by-step assistance
Get Started


