

Question
import numpy as np import scipy.linalg as linalg import matplotlib.pyplot as plt import csv #needed to read csv file import least_square as LS #will use
import numpy as np import scipy.linalg as linalg import matplotlib.pyplot as plt import csv #needed to read csv file import least_square as LS #will use the least square functions there for linear regression
#---------------------------------------------- def plot_GLOTI(datafile="GLB.Ts+dSST.csv"): # # read from the datafile, skip any comment lines that start with # # with open(datafile) as csvf: LOTIdata = csv.DictReader(filter(lambda row: row[0]!='#', csvf))
# # you are asked to get the data for the following 4 months # Jan=[]; Apr=[]; Jul=[]; Aug=[]
# you also need the Year for the xlabel Year=[] # #study the online manual for the csv.DictReader() function, then finish the following part #to save appropriate data in the above empty lists, remember you readin only str, but you #need float datatype for the plots # for line in LOTIdata:
# # plot the temperature deviation data of the four months you obtained from the csv file #
# ## do linear regression on the Jan and Aug data you obtained, using the ## least_square_poly() function from the imported LS module ## (two sample lines are provided below, you need to modify accordingly) # xv = np.arange(Year[0], Year[-1]+0.5, 0.5) #extrapolate over the Years #JulLS, Julstd = LS.least_square_poly(Year, Jul, 1, xv) #change this line to fit the Jan and Aug data
# # plot the linear regressions for the Jan and Aug data #
# # set legends, title, labels properly #
plt.savefig("plot_GLOTI.png") plt.show()
any helo would be great! Will thumbs up!
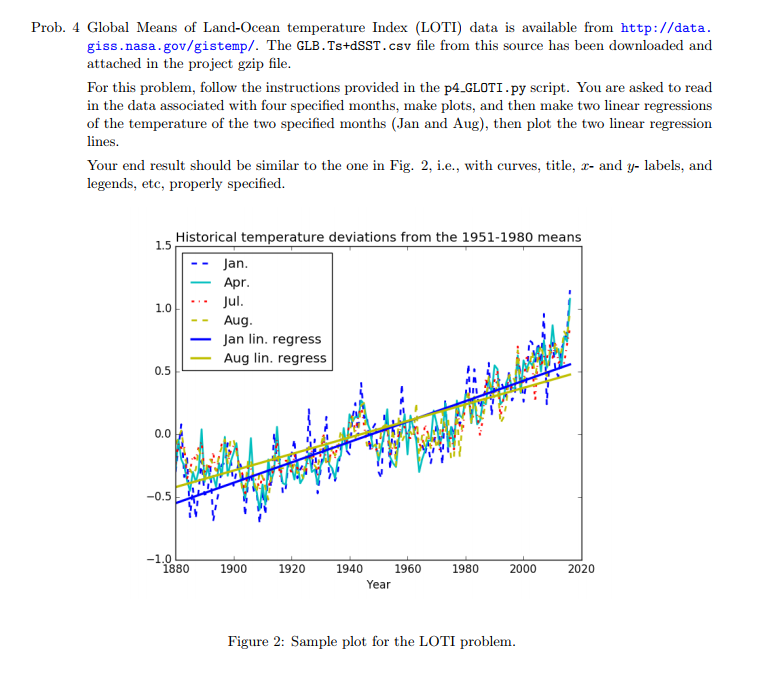
Prob. 4 Global Means of Land-Ocean temperature Index (LOTI) data is available from http://data giss.nasa.gov/gistemp/. The GLB.Ts+dSST.csv file from this source has been downloaded and attached in the project gzip file For this problem, follow the instructions provided in the p4.GLOTI.py script. You are asked to read in the data associated with four specified months, make plots, and then make two linear regressions of the temperature of the two specified months (Jan and Aug), then plot the two linear regression lines Your end result should be similar to the one in Fig. 2, i.e., with curves, title, x- and y- labels, and legends, etc, properly specified. 1.5 Historical temperature deviations from the 1951-1980 means --Jan Apr 1.0 Jul Aug -Jan lin. regress Aug lin, regress 0.5 0.0 -0.5 1880 1900 1920 1940 1960 1980 2000 2020 Year Figure 2: Sample plot for the LOTIStep by Step Solution
There are 3 Steps involved in it
Step: 1

Get Instant Access to Expert-Tailored Solutions
See step-by-step solutions with expert insights and AI powered tools for academic success
Step: 2

Step: 3
Ace Your Homework with AI
Get the answers you need in no time with our AI-driven, step-by-step assistance
Get Started
Upgrading Oracle Databases Oracle Database New Features
Authors: Charles Kim, Gary Gordhamer, Sean Scott
1st Edition
B0BL12WFP6, 979-8359657501