

Answered step by step
Verified Expert Solution
Question
1 Approved Answer
Import Statements Run the cell below to import the NumPy, Matplotlib, and math packages. [ ] import numpy as np import matplotilib.pyplot as plt import
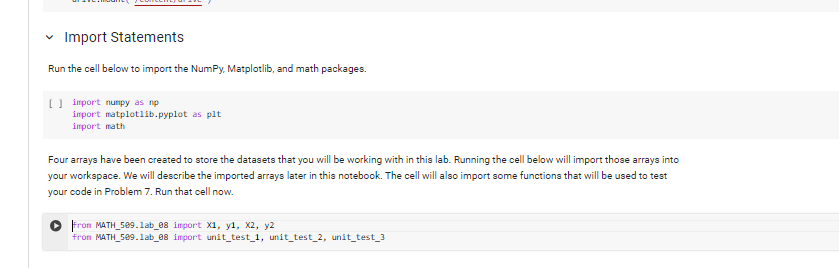
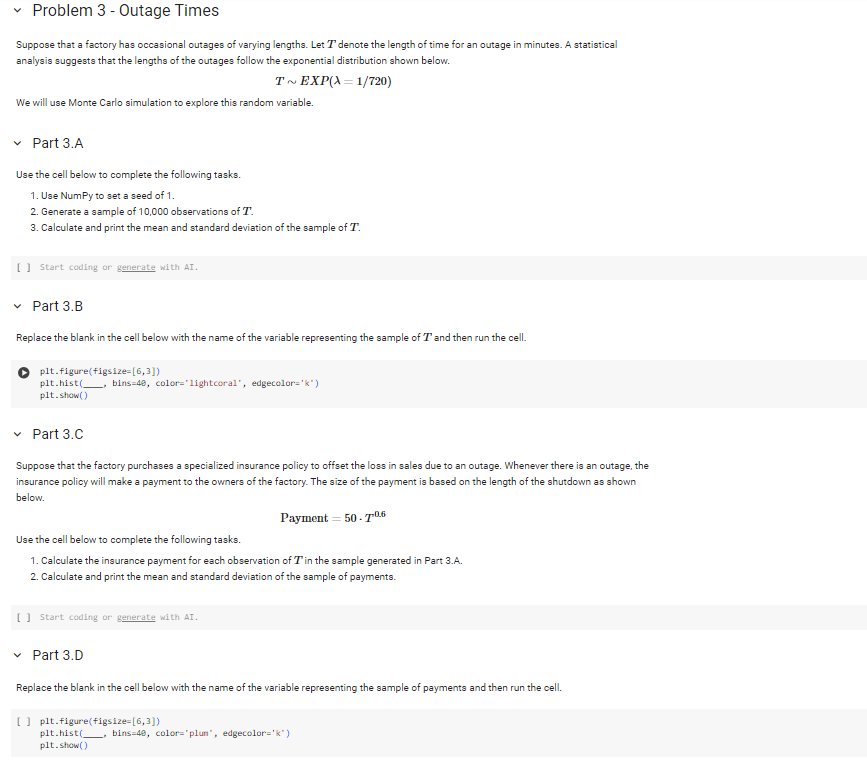 Import Statements Run the cell below to import the NumPy, Matplotlib, and math packages. [ ] import numpy as np import matplotilib.pyplot as plt import math Four arrays have been created to store the datasets that you will be working with in this lab. Running the cell below will import those arrays into your workspace. We will describe the imported arrays later in this notebook. The cell will also import some functions that will be used to test your code in Problem 7. Run that cell now. fron MATH_599.1ab_08 import x1,y1,x2,y2 fron MATH_599.1ab_68 import unit_test_1, unit_test_2, unit_test_3 Suppose that a factory has occasional outages of varying lengths. Let T denote the length of time for an outage in minutes. A statistical analysis suggests that the lengths of the outages follow the exponential distribution shown below. TEXP(=1/720) We will use Monte Carlo simulation to explore this random variable. Part 3.A Use the cell below to complete the following tasks. 1. Use NumPy to set a seed of 1. 2. Generate a sample of 10,000 observations of T. 3. Calculate and print the mean and standard deviation of the sample of T. [ ] Start coding or generate with AI. Part 3.B Replace the blank in the cell below with the name of the variable representing the sample of T and then run the cell. p1t.figure(figsize= [6,3]) plt.hist| , bins=49, color='1ightcoral', edgecolor='k") p1t.show() Part 3.C Suppose that the factory purchases a specialized insurance policy to offset the loss in sales due to an outage. Whenever there is an outage, the insurance policy will make a payment to the owners of the factory. The size of the payment is based on the length of the shutdown as shown below. Payment=50T0.6 Use the cell below to complete the following tasks. 1. Calculate the insurance payment for each observation of 'T in the sample generated in Part 3.A. 2. Calculate and print the mean and standard deviation of the sample of payments. [] start coding or generate with AI. Part 3.D Replace the blank in the cell below with the name of the variable representing the sample of payments and then run the cell. [ ] plt.figure(figsize= [6,3]) plt.hist(__, bins=49, color='plum", edgecolor='k") plt. show()
 Step by Step Solution
There are 3 Steps involved in it
Step: 1

Get Instant Access to Expert-Tailored Solutions
See step-by-step solutions with expert insights and AI powered tools for academic success
Step: 2

Step: 3
Ace Your Homework with AI
Get the answers you need in no time with our AI-driven, step-by-step assistance
Get Started
Databases And Python Programming MySQL MongoDB OOP And Tkinter
Authors: R. PANNEERSELVAM
1st Edition
9357011331, 978-9357011334