In[ 1: Step 1: Generating sample data This block of Python code will generate a unique sample of size 50 that you will use in
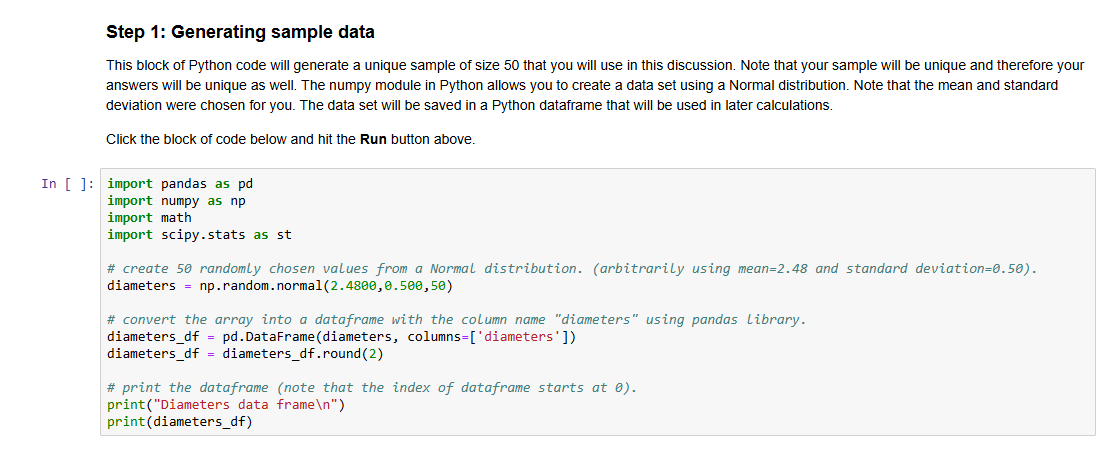
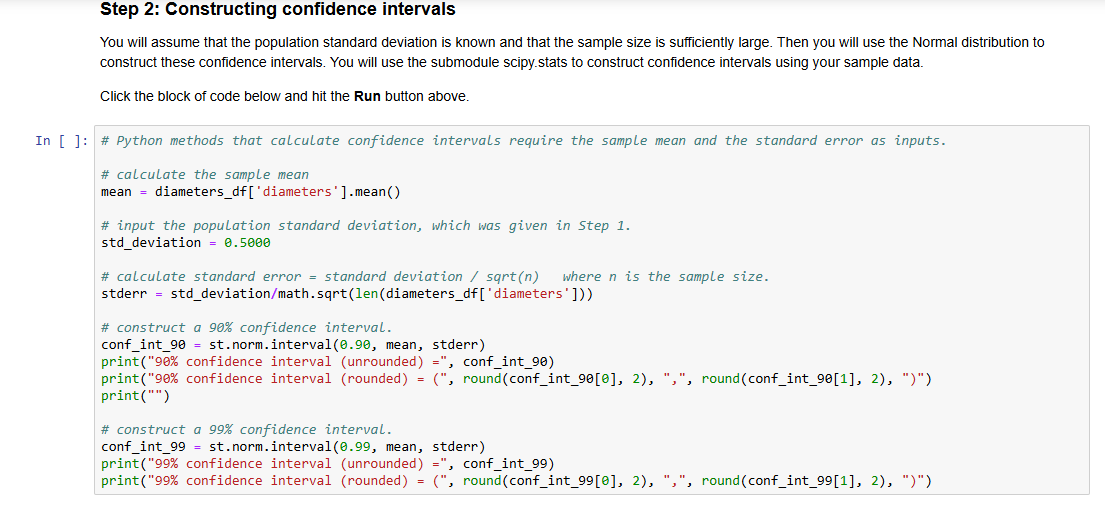
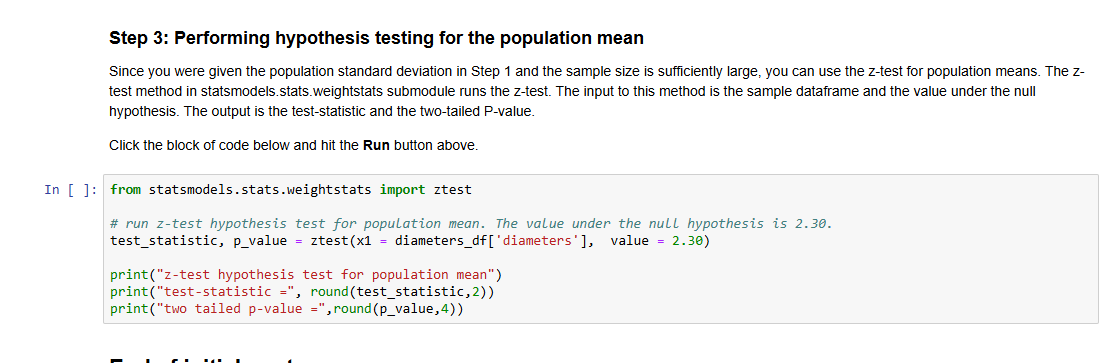
In[ 1: Step 1: Generating sample data This block of Python code will generate a unique sample of size 50 that you will use in this discussion. Note that your sample will be unique and therefore your answers will be unique as well. The numpy module in Python allows you to create a data set using a Normal distribution. Mote that the mean and standard deviation were chosen for you. The data set will be saved in a Python dataframe that will be used in later calculations. Click the block of code below and hit the Run button above. import pandas as pd import numpy as np import math import scipy.stats as st # create 58 randomly chosen values from a Normal distribution. (arbitrarily using mean=2.48 and standard deviation=6.58). diameters = np.random.normal(2.4808,8.508,58) # convert the array into a dataframe with the column name \"diameters\" using pandas Library. diameters_df = pd.DataFrame(diameters, columns=['diameters']) diameters_df = diameters_df.round(2) # print the dataframe (note that the index of dataframe starts at @). print("Diameters data frame\ ") print(diameters_df) Step 2: Constructing confidence intervals You will assume that the population standard deviation is known and that the sample size is sufficiently large. Then you will use the Normal distribution to construct these confidence intervals. You will use the submodule scipy stats to construct confidence intervals using your sample data. Click the block of code below and hit the Run button above. In [ ]: # Python methods that calculate confidence intervals require the sample mean and the standard error as inputs. # calculate the sample mean mean = diameters_df [ ' diameters' ]. mean( ) # input the population standard deviation, which was given in Step 1. std_deviation = 0.5000 # calculate standard error = standard deviation / sqrt(n) where n is the sample size. stderr = std_deviation/math. sqrt(len(diameters_of [ ' diameters' ]) ) # construct a 90% confidence interval. conf_int_90 = st. norm. interval(0.90, mean, stderr) print("90% confidence interval (unrounded) =", conf_int_90) print("90% confidence interval (rounded) = (", round(conf_int_90[0], 2), ",", round(conf_int_90[1], 2), ")") print("") # construct a 99% confidence interval. conf_int_99 = st. norm. interval(0.99, mean, stderr) print("99% confidence interval (unrounded) =", conf_int_99) print("99% confidence interval (rounded) = (", round(conf_int_99[0], 2), ",", round(conf_int_99[1], 2), ")")Step 3: Performing hypothesis testing for the population mean Since you were given the population standard deviation in Step 1 and the sample size is sufficiently large, you can use the z-test for population means. The z- test method in statsmodels.stats.weightstats submodule runs the z-test. The input to this method is the sample dataframe and the value under the null hypothesis. The output is the test-statistic and the two-tailed P-value. Click the block of code below and hit the Run button above. In [ ]: from statsmodels . stats. weightstats import ztest # run z-test hypothesis test for population mean. The value under the null hypothesis is 2.30. test_statistic, p_value = ztest(x1 = diameters_of [ 'diameters' ], value = 2.30) print("z-test hypothesis test for population mean") print("test-statistic =", round(test_statistic, 2) ) print("two tailed p-value =", round(p_value,4) )
Step by Step Solution
There are 3 Steps involved in it
Step: 1
Get Instant Access to Expert-Tailored Solutions
See step-by-step solutions with expert insights and AI powered tools for academic success
Step: 2
Step: 3
Ace Your Homework with AI
Get the answers you need in no time with our AI-driven, step-by-step assistance