In 2005, your investment company has offered to buy Ideko for $ 52.5 million. Using the APV method, estimate the value of Ideko and the NPV of the deal using the continuation value shown here The estimated unlevered cost of capital is 12.43 % Assume that the debt cost of capital is 6.9 %6Ideko's market share will increase by 0.45 % per year until 2010; investment, financing, and depreciation will be adjusted accordingly; and the projected improvements in working capital occur (i.e., Ideko's working capital requirements through 2010 will be as shown here). Ideko's projected free cash flows are shown here(the projected free cash flow for 2011 is $15,053,000 ). Ideko's projected income statements and balance sheets are shown here and here respectively. Assume an income tax rate of 35 % The projected dividend payments for 2006 thru 2010 are shown here:
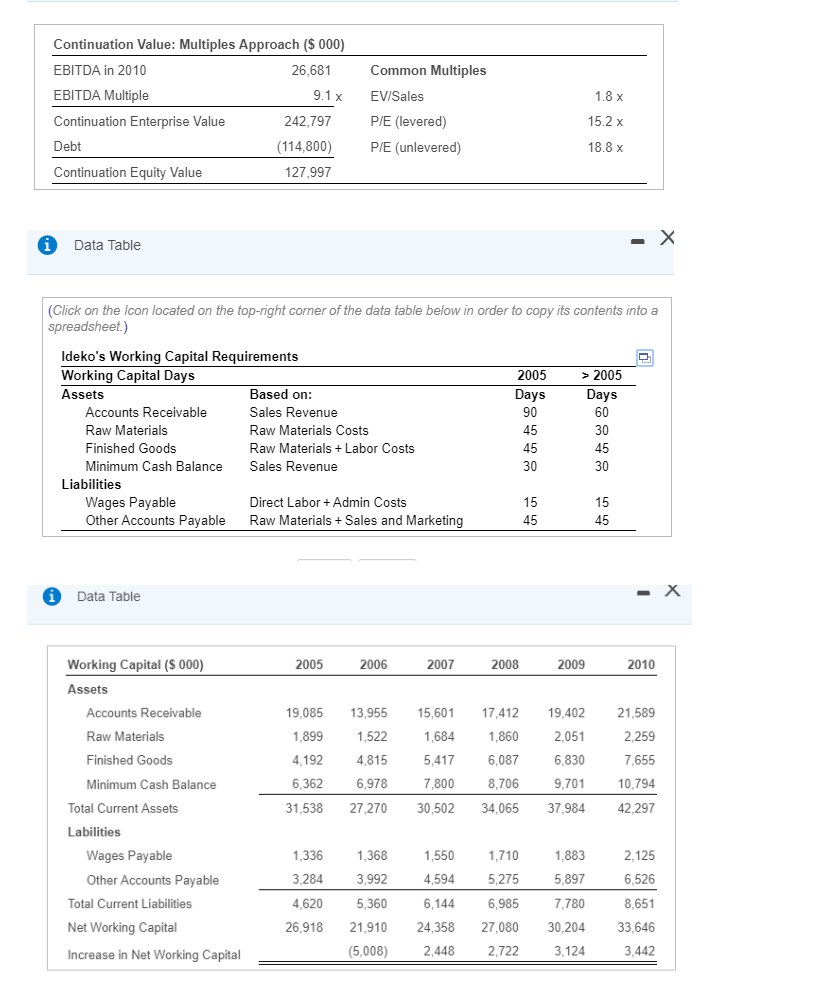
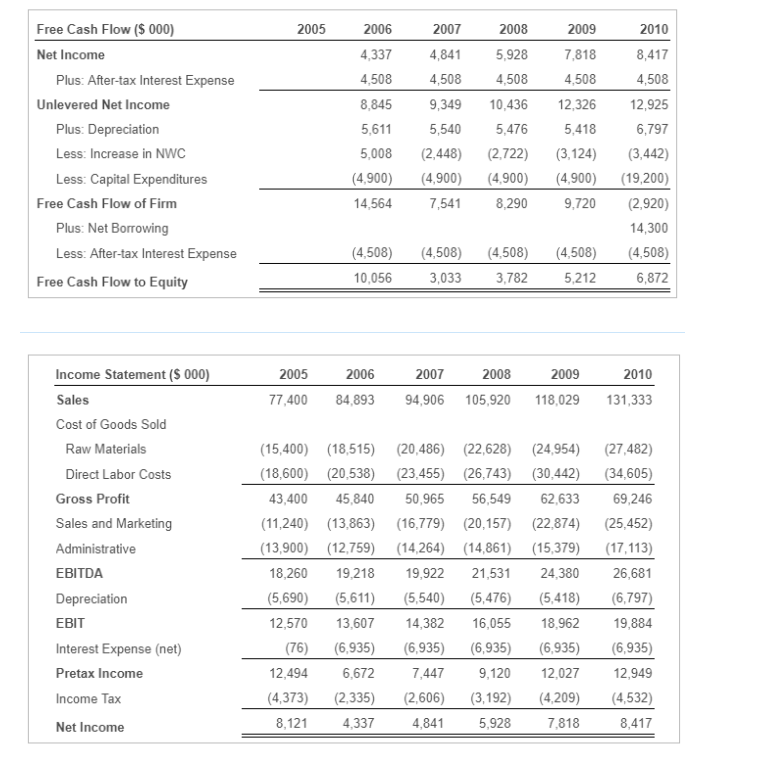
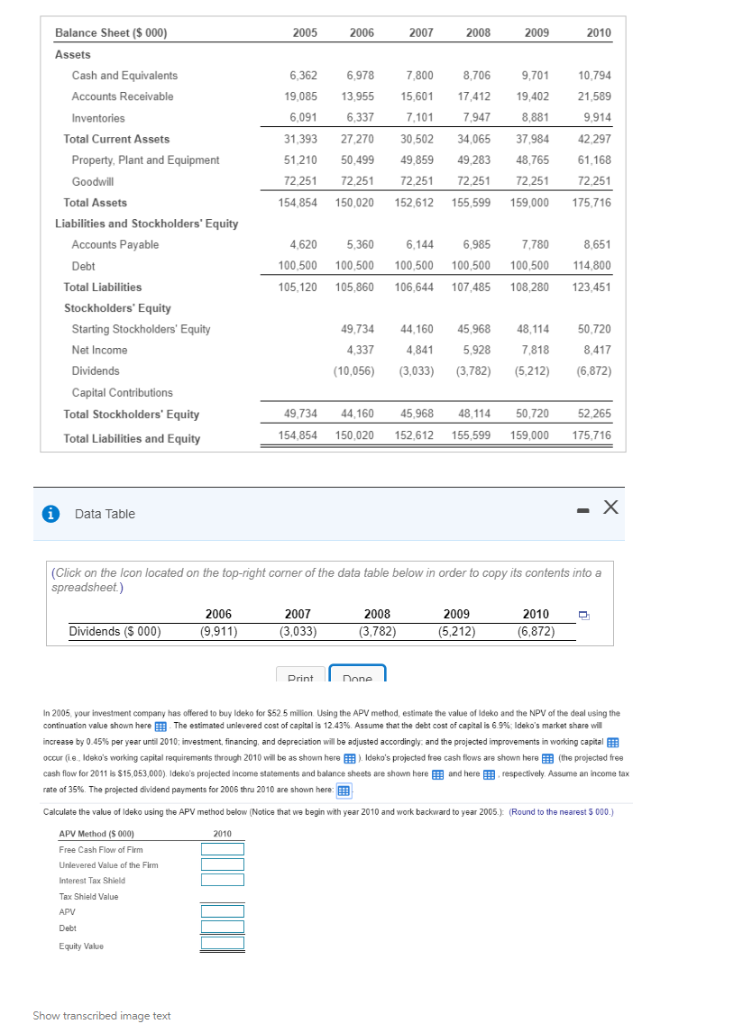
Continuation Value: Multiples Approach ($ 000) EBITDA in 2010 EBITDA Multiple Continuation Enterprise Value Debt Continuation Equity Value 26,681 Common Multiples 9.1x EVISales 242,797 P/E (levered) (114800 PIE (unlevered) 15.2 x 18.8 x 127,997 Data Table (Click on the Icon located on the top-right corner of the data table below in order to copy its contents into a spreadsheet) ldeko' Working Capital Days Assets s Working Capital Requirements > 2005 Days 60 30 45 30 2005 Days 90 Accounts Receivable Raw Materials Finished Goods Minimum Cash Balance Based on: Sales Revenue Raw Materials Costs Raw Materials Labor Costs Sales Revenue 30 Liabilities Wages Payable Other Accounts Payable Direct LaborAdmin Costs Raw Materials +Sales and Marketing Data Table Working Capital (S 000) 2005 2006 2007 2008 2009 2010 Assets Accounts Receivable Raw Materials Finished Goods Minimum Cash Balance 9,085 13,955 15,601 17,412 19,402 21,589 2,259 7,655 10,794 31,538 27,270 30,502 34,065 37,984 42,297 1,860 1.899 4,192 6,362 6,978 1,522 1,684 5,417 6,087 7,800 2,051 6,830 9,701 4,815 8,706 Total Current Assets Labilities 2,125 6,526 8,651 Wages Payable 4,594 5,275 6,1446,985 26,918 21,910 24,358 27,080 30,204 33,646 1,336 1,368 3,284 ,620 5,360 1,550 710 1883 5,897 7,780 3,992 Other Accounts Payable Total Current Liabilities Net Working Capital Increase in Net Working Capital 5,008)2,448 2,722 3,124 3,442 Free Cash Flow (S 000) 2005 2006 4,337 4,508 8,845 5,611 2007 4,841 4,508 9,349 10,436 12,326 12,925 5,540 2008 5,928 4.508 2009 7,818 4,508 2010 8,417 4,508 Net Income Plus: After-tax Interest Expense Unlevered Net Income 5,476 5,008 2,448 2,722 (3,124) 3,442) 4,900 (4,900) (4,900) (4,900) (19,200) 4,5647,541 8,290 9,720 (2,920) 5,418 6,797 Plus: Depreciation Less: Increase in NWC Less: Capital Expenditures Free Cash Flow of Firm Plus: Net Borrowing Less: After-tax Interest Expense 14,300 (4,508 (4,508) 4,508 (4,508) 4,508) 3,782 Free Cash Flow to Equity 10,056 3,033 5,212 6,872 2009 2010 Income Statement (S 000) Sales Cost of Goods Sold 2005 2006 2007 2008 77,400 84,893 94,906 105,920 118,029 131,333 15,400) 18,515) (20,486 (22,628) (24,954) 27,482) (18,600 (20,538) (23,455) (26,743) (30,442) 34,605) 43,400 45,840 50,965 56,549 62,633 69,246 (11,240 (13,863) (16,779) (20,157) (22,874) (25,452) 13,900) 2,75 14,264) (14,861) (15,379) (17,113) 18,260 19,2189,922 21,531 24,380 26,681 5,690 5,61 (5,540) 5,476) (5,418) 6,797) 19,884 (76) (6,935) (6,935) 6,935 (6,935) 6,935) 7,4479,120 2,027 12,949 (4,373 2,335) (2,606) 3,192) (4,209) 4,532) 8,417 Raw Materials Direct Labor Costs Gross Profit Sales and Marketing Administrative EBITDA Depreciation EBIT Interest Expense (net) Pretax Income Income Tax Net Income 12,570 13,607 14,382 16,055 18,962 12.494 6,672 8,121 4,337 4,841 5,928 7,818 Balance Sheet ($ 000) 2005 2006 2007 2008 2009 2010 Assets Cash and Equivalents 6,362 6,9787,800 8,706 9,701 10,794 9,085 13,955 15,601 17,412 19,402 21,589 9,914 31,393 27,27030,502 34,065 37,984 42.297 1,210 50,499 49,859 49,283 48,765 61.168 72.251 54,854 150,020 152,612 155,599159,000 175,716 Accounts Receivable 6091 6,337 7,101 7947 8,881 Total Current Assets Property, Plant and Equipment 72251 72.251 2251 72 2.251 2.251 Total Assets Liabilities and Stockholders' Equity Accounts Payable Debt 8,651 100,500 00,500 100,500 100,500 00,500 4.800 05,120 105,860 106,644 107,485 108,280 123,451 4,620 5,360 6,144 6,985 7,780 Total Liabilities Stockholders Equity Starting Stockholders' Equity Net Income 49,73444,160 45,968 48,11450,720 8,417 10,056)3,033) 3,782) 5,212) (6,872) ,3374,8415,928 7,818 Capital Contributions Total Stockholders' Equity Total Liabilities and Equity 9,734 44,160 45,968 48,114 50,720 52,265 54,854 150,020 152,612 155,599 159,000 175,716 Data Table (Click on the Icon located on the top-right corner of the data table below in order to copy its contents into a 2006 (9,911) 2007 (3,033) 2008 (3,782) 2009 (5,212) 2010 (6,872) Dividends ($ 000) none In 2005, your investment company has offered to buy ldeko for $52 5 million Using the APV method, estimate the value of Ideko and the NPV of the deal using the continuation value shown here The estimated unlevered cost of capital is 12 43% Assume that the debt cost of capital is 6 9% ldeko's market share will increase by 0 45% per year umi 2010 in vest ent financing and depreciation will be adjusted accordingly and the projected improvements in working capital occur i. ldeko's working capital equirements through 2010 will be as shown here> ldako s pr ected free cash flows are shown here(the pr ected free cash flow for 2011 ls $15,053,000) Ideko's projected income statements and balance sheets are shown here and here respectively Assume an income tax rate of 35% The projected dividend payments for 2006 thru 2010 are shown here Calculate the value of ldeko using the APV method below (Notice that we begin with year 2010 and work backward to year 2005 Round to the nearest 5 000.) APV Method (5 000) Free Cash Flow of Firm Unlevered Value of the Fim Interest Tax Shield Tax Shield Value APV Debt Equity Value 2010 Show transcribed image text Continuation Value: Multiples Approach ($ 000) EBITDA in 2010 EBITDA Multiple Continuation Enterprise Value Debt Continuation Equity Value 26,681 Common Multiples 9.1x EVISales 242,797 P/E (levered) (114800 PIE (unlevered) 15.2 x 18.8 x 127,997 Data Table (Click on the Icon located on the top-right corner of the data table below in order to copy its contents into a spreadsheet) ldeko' Working Capital Days Assets s Working Capital Requirements > 2005 Days 60 30 45 30 2005 Days 90 Accounts Receivable Raw Materials Finished Goods Minimum Cash Balance Based on: Sales Revenue Raw Materials Costs Raw Materials Labor Costs Sales Revenue 30 Liabilities Wages Payable Other Accounts Payable Direct LaborAdmin Costs Raw Materials +Sales and Marketing Data Table Working Capital (S 000) 2005 2006 2007 2008 2009 2010 Assets Accounts Receivable Raw Materials Finished Goods Minimum Cash Balance 9,085 13,955 15,601 17,412 19,402 21,589 2,259 7,655 10,794 31,538 27,270 30,502 34,065 37,984 42,297 1,860 1.899 4,192 6,362 6,978 1,522 1,684 5,417 6,087 7,800 2,051 6,830 9,701 4,815 8,706 Total Current Assets Labilities 2,125 6,526 8,651 Wages Payable 4,594 5,275 6,1446,985 26,918 21,910 24,358 27,080 30,204 33,646 1,336 1,368 3,284 ,620 5,360 1,550 710 1883 5,897 7,780 3,992 Other Accounts Payable Total Current Liabilities Net Working Capital Increase in Net Working Capital 5,008)2,448 2,722 3,124 3,442 Free Cash Flow (S 000) 2005 2006 4,337 4,508 8,845 5,611 2007 4,841 4,508 9,349 10,436 12,326 12,925 5,540 2008 5,928 4.508 2009 7,818 4,508 2010 8,417 4,508 Net Income Plus: After-tax Interest Expense Unlevered Net Income 5,476 5,008 2,448 2,722 (3,124) 3,442) 4,900 (4,900) (4,900) (4,900) (19,200) 4,5647,541 8,290 9,720 (2,920) 5,418 6,797 Plus: Depreciation Less: Increase in NWC Less: Capital Expenditures Free Cash Flow of Firm Plus: Net Borrowing Less: After-tax Interest Expense 14,300 (4,508 (4,508) 4,508 (4,508) 4,508) 3,782 Free Cash Flow to Equity 10,056 3,033 5,212 6,872 2009 2010 Income Statement (S 000) Sales Cost of Goods Sold 2005 2006 2007 2008 77,400 84,893 94,906 105,920 118,029 131,333 15,400) 18,515) (20,486 (22,628) (24,954) 27,482) (18,600 (20,538) (23,455) (26,743) (30,442) 34,605) 43,400 45,840 50,965 56,549 62,633 69,246 (11,240 (13,863) (16,779) (20,157) (22,874) (25,452) 13,900) 2,75 14,264) (14,861) (15,379) (17,113) 18,260 19,2189,922 21,531 24,380 26,681 5,690 5,61 (5,540) 5,476) (5,418) 6,797) 19,884 (76) (6,935) (6,935) 6,935 (6,935) 6,935) 7,4479,120 2,027 12,949 (4,373 2,335) (2,606) 3,192) (4,209) 4,532) 8,417 Raw Materials Direct Labor Costs Gross Profit Sales and Marketing Administrative EBITDA Depreciation EBIT Interest Expense (net) Pretax Income Income Tax Net Income 12,570 13,607 14,382 16,055 18,962 12.494 6,672 8,121 4,337 4,841 5,928 7,818 Balance Sheet ($ 000) 2005 2006 2007 2008 2009 2010 Assets Cash and Equivalents 6,362 6,9787,800 8,706 9,701 10,794 9,085 13,955 15,601 17,412 19,402 21,589 9,914 31,393 27,27030,502 34,065 37,984 42.297 1,210 50,499 49,859 49,283 48,765 61.168 72.251 54,854 150,020 152,612 155,599159,000 175,716 Accounts Receivable 6091 6,337 7,101 7947 8,881 Total Current Assets Property, Plant and Equipment 72251 72.251 2251 72 2.251 2.251 Total Assets Liabilities and Stockholders' Equity Accounts Payable Debt 8,651 100,500 00,500 100,500 100,500 00,500 4.800 05,120 105,860 106,644 107,485 108,280 123,451 4,620 5,360 6,144 6,985 7,780 Total Liabilities Stockholders Equity Starting Stockholders' Equity Net Income 49,73444,160 45,968 48,11450,720 8,417 10,056)3,033) 3,782) 5,212) (6,872) ,3374,8415,928 7,818 Capital Contributions Total Stockholders' Equity Total Liabilities and Equity 9,734 44,160 45,968 48,114 50,720 52,265 54,854 150,020 152,612 155,599 159,000 175,716 Data Table (Click on the Icon located on the top-right corner of the data table below in order to copy its contents into a 2006 (9,911) 2007 (3,033) 2008 (3,782) 2009 (5,212) 2010 (6,872) Dividends ($ 000) none In 2005, your investment company has offered to buy ldeko for $52 5 million Using the APV method, estimate the value of Ideko and the NPV of the deal using the continuation value shown here The estimated unlevered cost of capital is 12 43% Assume that the debt cost of capital is 6 9% ldeko's market share will increase by 0 45% per year umi 2010 in vest ent financing and depreciation will be adjusted accordingly and the projected improvements in working capital occur i. ldeko's working capital equirements through 2010 will be as shown here> ldako s pr ected free cash flows are shown here(the pr ected free cash flow for 2011 ls $15,053,000) Ideko's projected income statements and balance sheets are shown here and here respectively Assume an income tax rate of 35% The projected dividend payments for 2006 thru 2010 are shown here Calculate the value of ldeko using the APV method below (Notice that we begin with year 2010 and work backward to year 2005 Round to the nearest 5 000.) APV Method (5 000) Free Cash Flow of Firm Unlevered Value of the Fim Interest Tax Shield Tax Shield Value APV Debt Equity Value 2010 Show transcribed image text