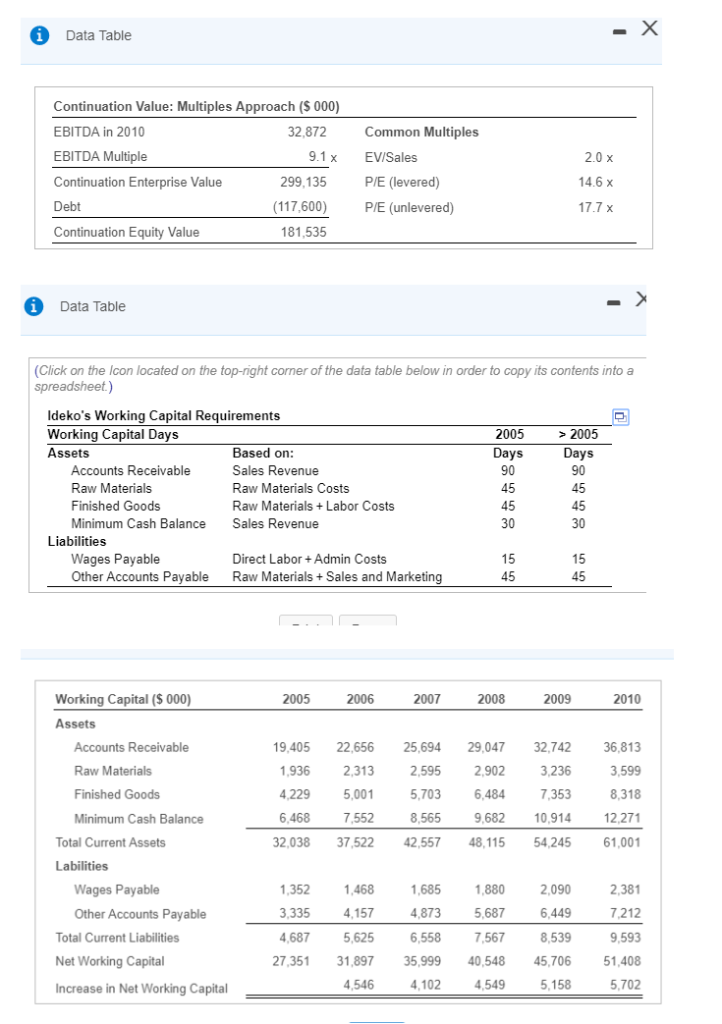
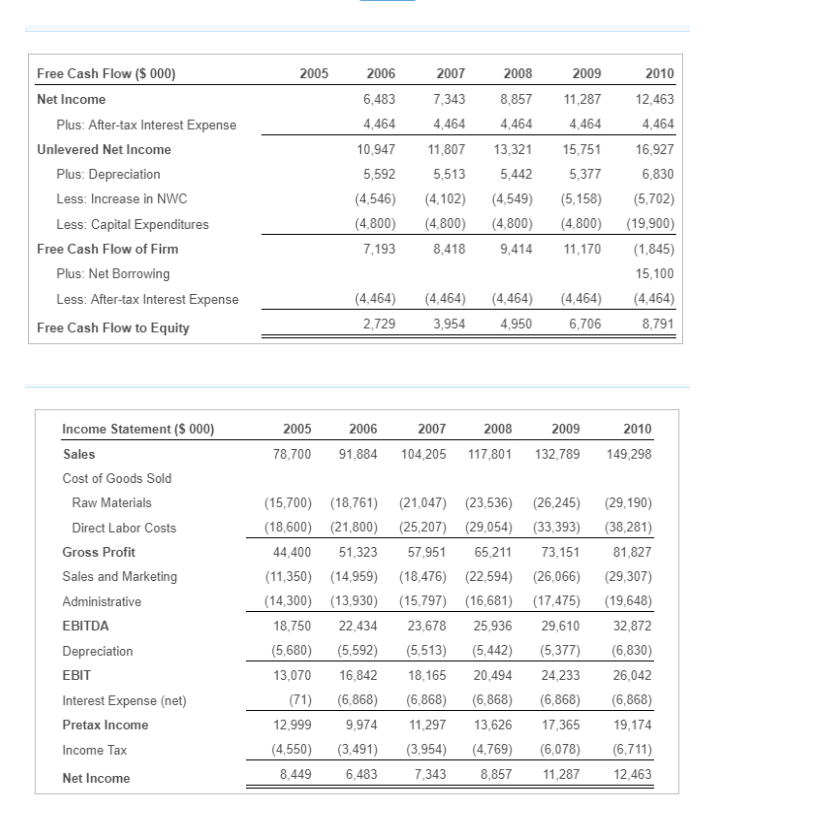
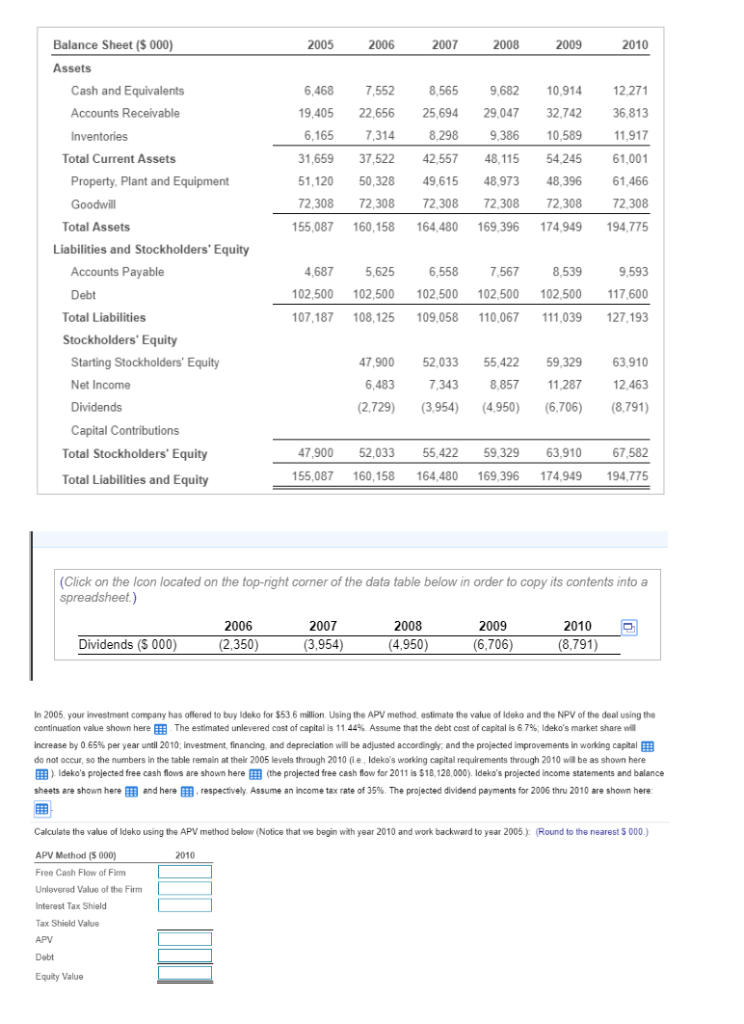
In 2005, your investment company has offered to buy Ideko for $ 53.6million. Using the APV method, estimate the value of Ideko and the NPV of the deal using the continuation value shown here The estimated unlevered cost of capital is11.44%. Assume that the debt cost of capital is 6.7% Ideko's market share will increase by 0.65% per year until 2010; investment, financing, and depreciation will be adjusted accordingly; and the projected improvements in working capital do not occur, so the numbers in the table remain at their 2005 levels through 2010 (i.e., Ideko's working capital requirements through 2010 will be as shown here). Ideko's projected free cash flows are shown here (the projected free cash flow for 2011 is $128,000 ).Ideko's projected income statements and balance sheets are shown here and here respectively. Assume an income tax rate of 35%.The projected dividend payments for 2006 thru 2010 are shown here
2010 6,483 7,343 8,857 11,287 12,463 4,464 16,927 6,830 4,546) 42 (4,549) 5,158) (5,702) (4,800 (4,800) (4,800) (4,800) (19,900) 7,193 8,4189,414,0 1,845) 15,100 4,464) (4,464) (4,464) (4,464) (4,464) 8,791 Free Cash Flow (S 000) 2005 2006 2007 2008 2009 Net Income 4,464 0,94711,807 13,321 15,751 5,377 Plus: After-tax Interest Expense 4,464 4,464 4,464 nlevered Net Income 5,513 13 5,442 Plus: Depreciation Less: Increase in NWC Less: Capital Expenditures 5,592 Free Cash Flow of Firm Plus: Net Borrowing Less: After-tax Interest Expense Free Cash Flow to Equity 2,729 3,954 4,950 6,706 Income Statement ($ 000) Sales Cost of Goods Sold 2005 2006 2007 2008 2009 2010 78,700 91,884 104,205 117,801 132,789 149,298 Raw Materials Direct Labor Costs Gross Profit Sales and Marketing Administrative EBITDA Depreciation EBIT Interest Expense (net) Pretax Income Income Tax Net Income 15,700) 18,76) (21,047) (23,536) (26,245) (29,190) (18,600 21,800) (25,207) (29,054) (33,393) (38,281) 44,40051,323 57,951 65,211 73,151 81,827 (11,350) (14,959) (18,476) (22,594) (26,066) 29,307) 14,300 13,930) (15,797) (16,681) (17,475) (19,648) 18,750 22,434 23,678 25,936 29,610 32,872 5,680) 5,592) (5,513) 5,442) 5,377) (6,830) 3,07016,842 18,165 20,494 24,233 26,042 (71) (6,868) 6,868) (6,868) 6,868 (6,868) 2,999 9,974 11,297 13,626 17,365 9,174 4,550) (3,491) (3,954) (4,769) 6,078) (6,711) 12,463 8,449 6,483 7,343 8,857 11,287 2005 Balance Sheet ($ 000) Assets 2006 2007 2008 2009 2010 Cash and Equivalents Accounts Receivable Inventories 6,468 7,552 9,405 22,656 25,694 29,047 6,165 8,565 9,682 10,914 12.271 36,813 11.917 1,659 37,522 2,557 48,115 54245 61,001 61,466 72.308 55,087160,158 164,480 169,396174,949 94 775 32,742 7,314 8,298 9,386 10,589 1191 Total Current Assets Property, Plant and Equipment 51,120 50,328 49,615 48,97348,39661 Goodwill 2,308 72,308 72,308 72,308 72,308 Total Assets Liabilities and Stockholders' Equity 9,593 02,500 02,500 102,500 102,500 102,500 117,600 07,187 108,125 109,058 110,067 111039 127,193 Accounts Payable 4,6875,625 6,558 7,5678,539 Debt Total Liabilities Stockholders Equity Starting Stockholders' Equity Net Income Dividends 63,910 7,343 8,85711,287 12,463 (2,729) (3,954) (4,950)(6,706)(8,791) 7,900 52,033 55,422 59,329 6,483 Total Stockholders' Equity Total Liabilities and Equity 47,900 52,033 55,422 59,329 63,910 67.582 55,087 60,158 164,480 169,396 174,949 194,775 Click on the Icon located on the top-right corner of the data table below in order to copy its contents into a spreadsheet) 2006 350) 2007 (3,954) 2008 (4,950) 2009 2010 Dividends (S 000) (6,706) (8,791) In 2005, your investment company has oflered to buy Ideko for $53 6 million. Using the APV method, estimate the value of Ideko and the NPV of the deal using the continuation value shown here he estimated unlevered cost of capital is 11 44% Assume that the debt cost of capital is 6 7%; ldeko's market share wa increase by 0 65% per year until 2010, investment financing and depreciation will be adjusted according y and the projected improvements in working capital do not occur, so the numbers in the table remain at their 2005 levels through 2010 (ie, Ideko's working capital requirements through 2010 will be as shown here Ideko's projected free cash flows are shown here (the projected free cash flow for 2011 is $18,128,000) Ideko's projected income statements and balance sheets are shown here and here respectively Assume an income tax rate of 35% The projected dividend payments for 2006 thru 2010 are shown here Calculate the value of Ideko using the APV method below (Notice that we begin with year 2010 and work backward to year 2005) Round to the nearest 5 000.) APV Method (S 000) Free Cash Flow of Fim Unleverad Value of the Firm Interest Tax Shield Tax Shield Value APV Debt Equity Value 2010 2010 6,483 7,343 8,857 11,287 12,463 4,464 16,927 6,830 4,546) 42 (4,549) 5,158) (5,702) (4,800 (4,800) (4,800) (4,800) (19,900) 7,193 8,4189,414,0 1,845) 15,100 4,464) (4,464) (4,464) (4,464) (4,464) 8,791 Free Cash Flow (S 000) 2005 2006 2007 2008 2009 Net Income 4,464 0,94711,807 13,321 15,751 5,377 Plus: After-tax Interest Expense 4,464 4,464 4,464 nlevered Net Income 5,513 13 5,442 Plus: Depreciation Less: Increase in NWC Less: Capital Expenditures 5,592 Free Cash Flow of Firm Plus: Net Borrowing Less: After-tax Interest Expense Free Cash Flow to Equity 2,729 3,954 4,950 6,706 Income Statement ($ 000) Sales Cost of Goods Sold 2005 2006 2007 2008 2009 2010 78,700 91,884 104,205 117,801 132,789 149,298 Raw Materials Direct Labor Costs Gross Profit Sales and Marketing Administrative EBITDA Depreciation EBIT Interest Expense (net) Pretax Income Income Tax Net Income 15,700) 18,76) (21,047) (23,536) (26,245) (29,190) (18,600 21,800) (25,207) (29,054) (33,393) (38,281) 44,40051,323 57,951 65,211 73,151 81,827 (11,350) (14,959) (18,476) (22,594) (26,066) 29,307) 14,300 13,930) (15,797) (16,681) (17,475) (19,648) 18,750 22,434 23,678 25,936 29,610 32,872 5,680) 5,592) (5,513) 5,442) 5,377) (6,830) 3,07016,842 18,165 20,494 24,233 26,042 (71) (6,868) 6,868) (6,868) 6,868 (6,868) 2,999 9,974 11,297 13,626 17,365 9,174 4,550) (3,491) (3,954) (4,769) 6,078) (6,711) 12,463 8,449 6,483 7,343 8,857 11,287 2005 Balance Sheet ($ 000) Assets 2006 2007 2008 2009 2010 Cash and Equivalents Accounts Receivable Inventories 6,468 7,552 9,405 22,656 25,694 29,047 6,165 8,565 9,682 10,914 12.271 36,813 11.917 1,659 37,522 2,557 48,115 54245 61,001 61,466 72.308 55,087160,158 164,480 169,396174,949 94 775 32,742 7,314 8,298 9,386 10,589 1191 Total Current Assets Property, Plant and Equipment 51,120 50,328 49,615 48,97348,39661 Goodwill 2,308 72,308 72,308 72,308 72,308 Total Assets Liabilities and Stockholders' Equity 9,593 02,500 02,500 102,500 102,500 102,500 117,600 07,187 108,125 109,058 110,067 111039 127,193 Accounts Payable 4,6875,625 6,558 7,5678,539 Debt Total Liabilities Stockholders Equity Starting Stockholders' Equity Net Income Dividends 63,910 7,343 8,85711,287 12,463 (2,729) (3,954) (4,950)(6,706)(8,791) 7,900 52,033 55,422 59,329 6,483 Total Stockholders' Equity Total Liabilities and Equity 47,900 52,033 55,422 59,329 63,910 67.582 55,087 60,158 164,480 169,396 174,949 194,775 Click on the Icon located on the top-right corner of the data table below in order to copy its contents into a spreadsheet) 2006 350) 2007 (3,954) 2008 (4,950) 2009 2010 Dividends (S 000) (6,706) (8,791) In 2005, your investment company has oflered to buy Ideko for $53 6 million. Using the APV method, estimate the value of Ideko and the NPV of the deal using the continuation value shown here he estimated unlevered cost of capital is 11 44% Assume that the debt cost of capital is 6 7%; ldeko's market share wa increase by 0 65% per year until 2010, investment financing and depreciation will be adjusted according y and the projected improvements in working capital do not occur, so the numbers in the table remain at their 2005 levels through 2010 (ie, Ideko's working capital requirements through 2010 will be as shown here Ideko's projected free cash flows are shown here (the projected free cash flow for 2011 is $18,128,000) Ideko's projected income statements and balance sheets are shown here and here respectively Assume an income tax rate of 35% The projected dividend payments for 2006 thru 2010 are shown here Calculate the value of Ideko using the APV method below (Notice that we begin with year 2010 and work backward to year 2005) Round to the nearest 5 000.) APV Method (S 000) Free Cash Flow of Fim Unleverad Value of the Firm Interest Tax Shield Tax Shield Value APV Debt Equity Value 2010