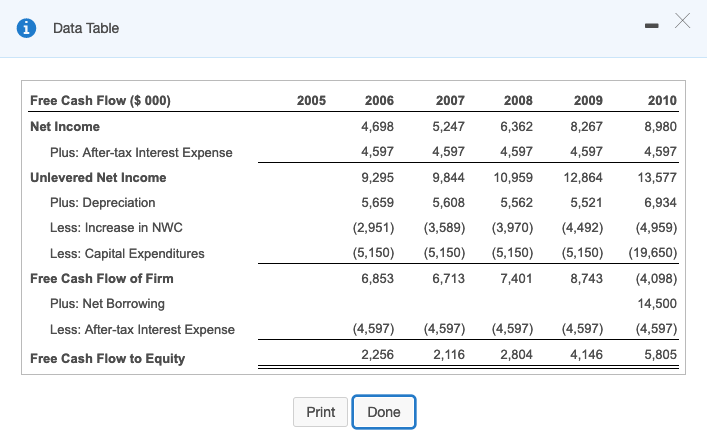
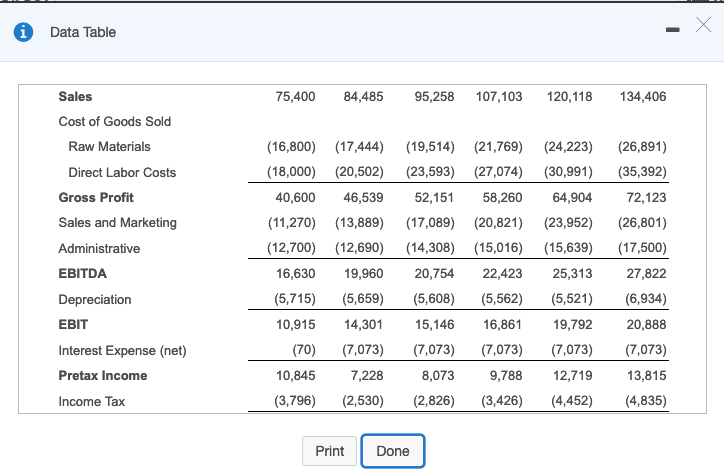
In 2005, your investment company has offered to buy Ideko for$53.5 million. Using the APV method, estimate the value of Ideko and the NPV of the deal using the continuation value shown down in the photo. The estimated unlevered cost of capital is 12.52$. Assume that the debt cost of capital is 6.9 %; Ideko's market share will increase by 0.60% per year until 2010; investment, financing, and depreciation will be adjusted accordingly; and the projected improvements in working capital do not occur, so the numbers in the table down below in the photo remain at their 2005 levels through 2010 (i.e., Ideko's working capital requirements through 2010 will be as shown down in the photo. Ideko's projected free cash flows are shown down in the photo. (the projected free cash flow for 2011 is ($15,216,000).
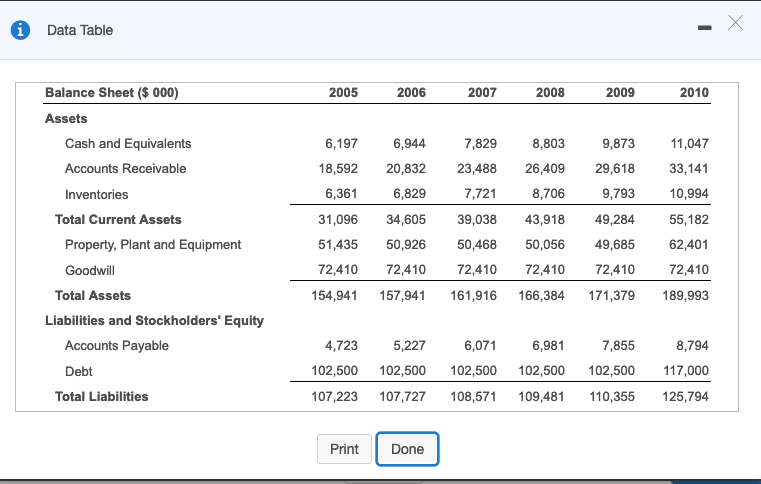
Ideko's projected income statements and balance sheets are shown here. respectively. Assume an income tax rate of 35 %35%.
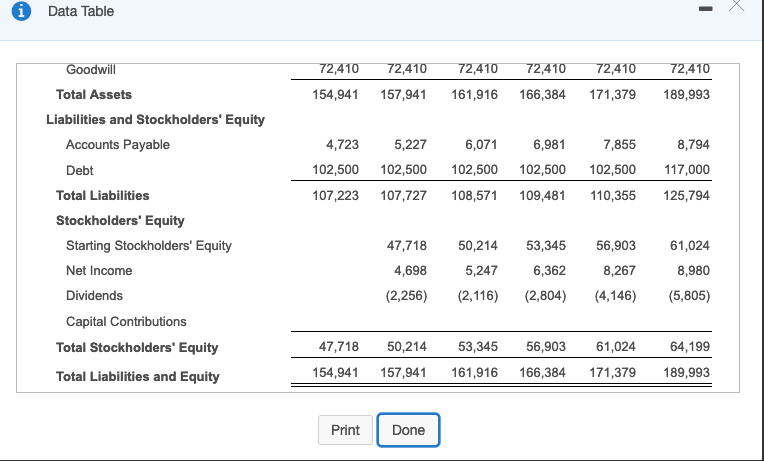
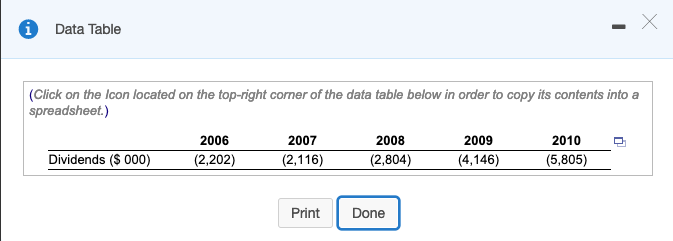
The projected dividend payments for 2006 thru 2010 are shown here in the photo. 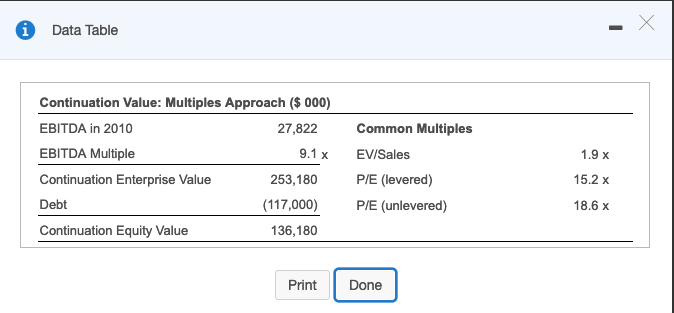
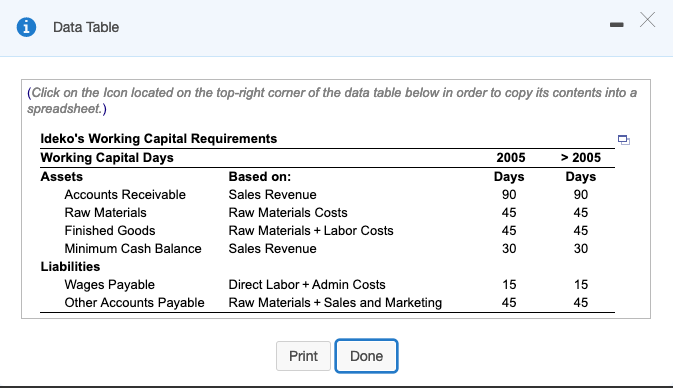
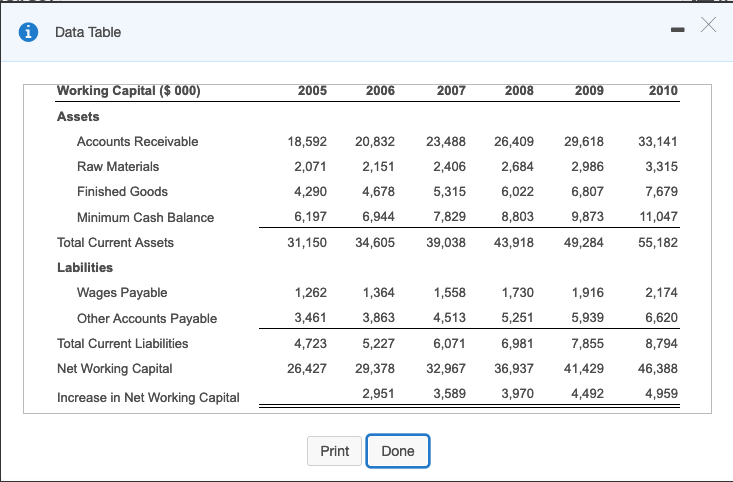
Data Table Continuation Value: Multiples Approach ( 000) EBITDA in 2010 EBITDA Multiple 27,822 Common Multiples 9.1x EVISales 253,180 P/E (levered) 117,000) PE (unlevered) 136,180 1.9 x 15.2 x 18.6 x ion Enterprise Value Debt Continuation Equity Value Print Done Data Table (Click on the Icon located on the top-right corner of the data table below in order to copy its contents into a spreadsheet.) ldeko's Working Capital Requirements Working Capital Days Assets Accounts Receivable Raw Materials Finished Goods Minimum Cash Balance Based on: Sales Revenue Raw Materials Costs Raw MaterialsLabor Costs Sales Revenue 2005 Days 90 45 45 30 > 2005 Days 90 45 45 30 Liabilities 15 45 15 45 Direct Labor +Admin Costs Wages Payable Other Accounts Payable Raw Materials +Sales and Marketing Print Done Data Table Working Capital ($ 000) 2005 2006 2007 2008 2009 2010 Assets Accounts Receivable Raw Materials Finished Goods Minimum Cash Balance 33,141 3,315 7,679 11,047 31,150 34,605 39,038 43,918 49,284 55,182 18,592 20,832 23,488 26,409 29,618 2,986 6,807 9,873 2,0712,151 4,290 4,678 6,197 2,406 5,315 7,829 2,684 6,022 8,803 6,944 Total Current Assets Labilities 1,916 5,939 7,855 Wages Payable 1,262 1,364 3,863 4,723 5,227 26,427 29,378 2,951 1,558 4,513 5,251 6,071 1,730 2,174 6,620 8,794 46,388 4,959 3,461 Other Accounts Payable Total Current Liabilities Net Working Capital Increase in Net Working Capital 6,981 32,967 36,937 41,429 3,970 3,589 4,492 Print Done Data Table Free Cash Flow ($000) 2005 2006 4,698 4,597 9,295 5,659 2007 5,247 6,362 4,597 9,844 10,959 5,608 2008 2009 8,267 4,597 12,864 5,521 2010 8,980 4,597 13,577 6,934 Net Income Plus: After-tax Interest Expense 4,597 Unlevered Net Income Plus: Depreciation Less: Increase in NWC Less: Capital Expenditures 5,562 (2,951) (3,589) (3,970 (4,492) 4,959) (5,150 50 (5,150) 5,150) 19,650) 7,401 Free Cash Flow of Firm 6,853 6,713 8,743(4,098) Plus: Net Borrowing Less: After-tax Interest Expense 14,500 (4,597) (4,597 (4,597) (4,597) 4,597) Free Cash Flow to Equity 2,256 2,116 2,804 4,146 5,805 Print Done Data Table Sales 75,400 84,485 95,258107,103 120,118 134,406 Cost of Goods Sold Raw Materials Direct Labor Costs Gross Profit Sales and Marketing Administrative EBITDA Depreciation EBIT Interest Expense (net) Pretax Income Income Tax (16,800 17,444) 19,514) (21,769) (24,223) (26,891) (18,000) (20,502) (23,593) (27,074) (30,991) (35,392) 72,123 (11,270) (13,889) (17,089) 20,821) (23,952) (26,801) (12,700 (12,690) (14,308) (15,016) (15,639) (17,500) 27,822 (5,715 (5,659 (5,608) (5,562) (5,521) (6,934) 20,888 (70) (7,073) (7,073) 7,073) 7,073) (7,073) 13,815 (3,796) (2,530 (2,826) (3,426) 4,452) (4,835) 40,600 46,539 52,151 58,260 64,904 16,630 19,960 20,754 22,423 25,313 10,915 14,301 15,146 16,861 19,792 10,845 7,228 8,073 9,788 12,719 Print Done Data Table Balance Sheet ($000) 2005 2006 2007 2008 2009 2010 Assets Cash and Equivalents Accounts Receivable Inventories 9,873 832 23,488 26,409 29,618 9,793 6,197 7,829 8,803 11,047 33,141 10,994 31,096 34,605 39,038 43,918 49,284 55,182 62,401 72,410 154,941 157,941 161,916 166,384 171,379 189,993 6,944 6,361 6,829 7,721 8,706 Total Current Assets Property, Plant and Equipment 51,435 50,926 50,468 50,056 49,685 Goodwill 72,410 72,410 72,410 72,410 72,410 Total Assets Liabilities and Stockholders' Equity 8,794 102,500 102,500 102,500 102,500 102,500 117,000 07,223 107,727 108,571 109,481110,355 125,794 Accounts Payable 4,723 5,227 6,071 6,981 7,855 Debt Total Liabilities Print Done Data Table WI Total Assets 154,941 157,941 161,916 166,384 171,379 189,993 Liabilities and Stockholders' Equity 8,794 102,500 102,500 102,500 102,500 102,500 117,000 07,223 107,727 108,571 109,481110,355 125,794 Accounts Payable 4,723 5,227 6,071 6,981 7,855 Debt Total Liabilities Stockholders' Equity Starting Stockholders' Equity Net Income Dividends Capital Contributions 47,718 50,214 53,345 56,903 61,024 8,980 (2,256) 2,116 (2,804) (4,146) 5,805) 4,698 5,247 6,362 8,267 Total Stockholders Equity 47,718 50,214 53,345 56,903 61,024 64,199 Total Liabilities and Equity 154,941 157,941 161,916 166,384 171,379 189,993 Print Done 1 Data Table (Click on the Icon located on the top-right corner of the data table below in order to copy its contents into a spreadsheet.) 2006 2007 2008 2010 2009 (4,146) e Dividends ($ 000) 2.202) (5,805) Dividends (S 000) (2,202) (2804) ( PrintDone Data Table Continuation Value: Multiples Approach ( 000) EBITDA in 2010 EBITDA Multiple 27,822 Common Multiples 9.1x EVISales 253,180 P/E (levered) 117,000) PE (unlevered) 136,180 1.9 x 15.2 x 18.6 x ion Enterprise Value Debt Continuation Equity Value Print Done Data Table (Click on the Icon located on the top-right corner of the data table below in order to copy its contents into a spreadsheet.) ldeko's Working Capital Requirements Working Capital Days Assets Accounts Receivable Raw Materials Finished Goods Minimum Cash Balance Based on: Sales Revenue Raw Materials Costs Raw MaterialsLabor Costs Sales Revenue 2005 Days 90 45 45 30 > 2005 Days 90 45 45 30 Liabilities 15 45 15 45 Direct Labor +Admin Costs Wages Payable Other Accounts Payable Raw Materials +Sales and Marketing Print Done Data Table Working Capital ($ 000) 2005 2006 2007 2008 2009 2010 Assets Accounts Receivable Raw Materials Finished Goods Minimum Cash Balance 33,141 3,315 7,679 11,047 31,150 34,605 39,038 43,918 49,284 55,182 18,592 20,832 23,488 26,409 29,618 2,986 6,807 9,873 2,0712,151 4,290 4,678 6,197 2,406 5,315 7,829 2,684 6,022 8,803 6,944 Total Current Assets Labilities 1,916 5,939 7,855 Wages Payable 1,262 1,364 3,863 4,723 5,227 26,427 29,378 2,951 1,558 4,513 5,251 6,071 1,730 2,174 6,620 8,794 46,388 4,959 3,461 Other Accounts Payable Total Current Liabilities Net Working Capital Increase in Net Working Capital 6,981 32,967 36,937 41,429 3,970 3,589 4,492 Print Done Data Table Free Cash Flow ($000) 2005 2006 4,698 4,597 9,295 5,659 2007 5,247 6,362 4,597 9,844 10,959 5,608 2008 2009 8,267 4,597 12,864 5,521 2010 8,980 4,597 13,577 6,934 Net Income Plus: After-tax Interest Expense 4,597 Unlevered Net Income Plus: Depreciation Less: Increase in NWC Less: Capital Expenditures 5,562 (2,951) (3,589) (3,970 (4,492) 4,959) (5,150 50 (5,150) 5,150) 19,650) 7,401 Free Cash Flow of Firm 6,853 6,713 8,743(4,098) Plus: Net Borrowing Less: After-tax Interest Expense 14,500 (4,597) (4,597 (4,597) (4,597) 4,597) Free Cash Flow to Equity 2,256 2,116 2,804 4,146 5,805 Print Done Data Table Sales 75,400 84,485 95,258107,103 120,118 134,406 Cost of Goods Sold Raw Materials Direct Labor Costs Gross Profit Sales and Marketing Administrative EBITDA Depreciation EBIT Interest Expense (net) Pretax Income Income Tax (16,800 17,444) 19,514) (21,769) (24,223) (26,891) (18,000) (20,502) (23,593) (27,074) (30,991) (35,392) 72,123 (11,270) (13,889) (17,089) 20,821) (23,952) (26,801) (12,700 (12,690) (14,308) (15,016) (15,639) (17,500) 27,822 (5,715 (5,659 (5,608) (5,562) (5,521) (6,934) 20,888 (70) (7,073) (7,073) 7,073) 7,073) (7,073) 13,815 (3,796) (2,530 (2,826) (3,426) 4,452) (4,835) 40,600 46,539 52,151 58,260 64,904 16,630 19,960 20,754 22,423 25,313 10,915 14,301 15,146 16,861 19,792 10,845 7,228 8,073 9,788 12,719 Print Done Data Table Balance Sheet ($000) 2005 2006 2007 2008 2009 2010 Assets Cash and Equivalents Accounts Receivable Inventories 9,873 832 23,488 26,409 29,618 9,793 6,197 7,829 8,803 11,047 33,141 10,994 31,096 34,605 39,038 43,918 49,284 55,182 62,401 72,410 154,941 157,941 161,916 166,384 171,379 189,993 6,944 6,361 6,829 7,721 8,706 Total Current Assets Property, Plant and Equipment 51,435 50,926 50,468 50,056 49,685 Goodwill 72,410 72,410 72,410 72,410 72,410 Total Assets Liabilities and Stockholders' Equity 8,794 102,500 102,500 102,500 102,500 102,500 117,000 07,223 107,727 108,571 109,481110,355 125,794 Accounts Payable 4,723 5,227 6,071 6,981 7,855 Debt Total Liabilities Print Done Data Table WI Total Assets 154,941 157,941 161,916 166,384 171,379 189,993 Liabilities and Stockholders' Equity 8,794 102,500 102,500 102,500 102,500 102,500 117,000 07,223 107,727 108,571 109,481110,355 125,794 Accounts Payable 4,723 5,227 6,071 6,981 7,855 Debt Total Liabilities Stockholders' Equity Starting Stockholders' Equity Net Income Dividends Capital Contributions 47,718 50,214 53,345 56,903 61,024 8,980 (2,256) 2,116 (2,804) (4,146) 5,805) 4,698 5,247 6,362 8,267 Total Stockholders Equity 47,718 50,214 53,345 56,903 61,024 64,199 Total Liabilities and Equity 154,941 157,941 161,916 166,384 171,379 189,993 Print Done 1 Data Table (Click on the Icon located on the top-right corner of the data table below in order to copy its contents into a spreadsheet.) 2006 2007 2008 2010 2009 (4,146) e Dividends ($ 000) 2.202) (5,805) Dividends (S 000) (2,202) (2804) ( PrintDone