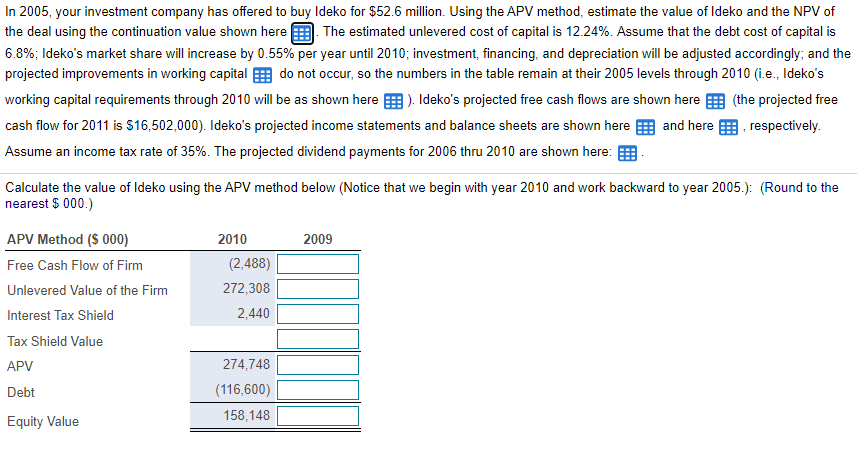

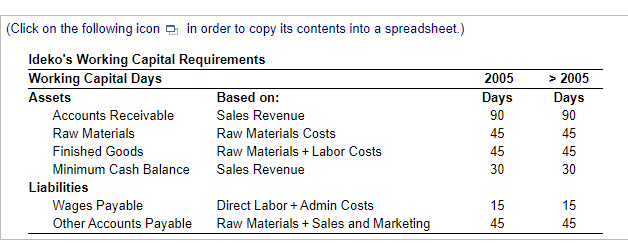
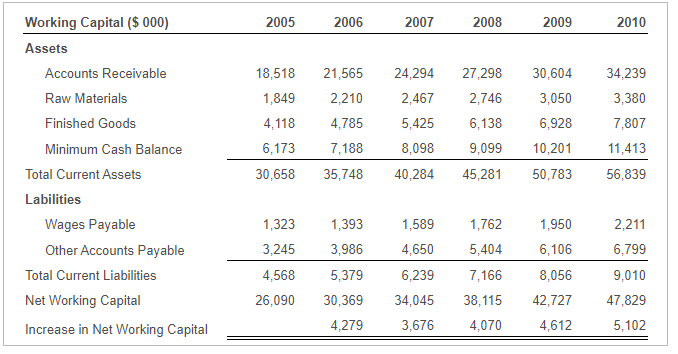
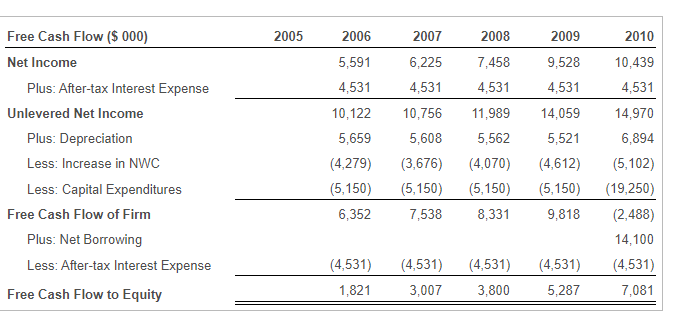
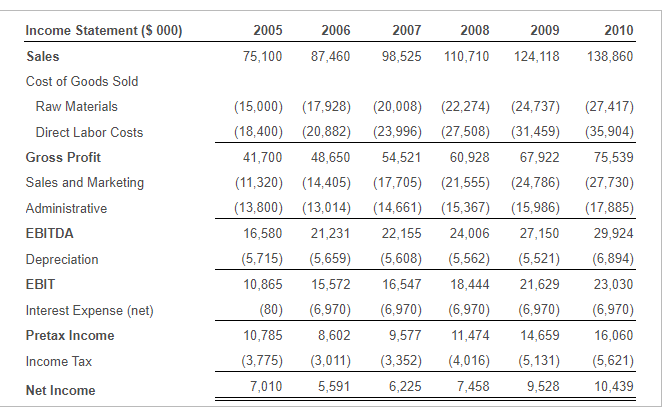
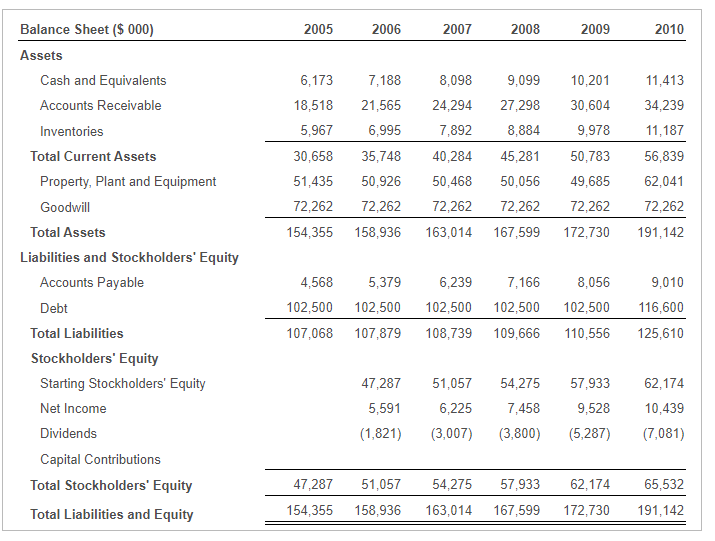

In 2005, your investment company has offered to buy Ideko for $52.6 million. Using the APV method, estimate the value of Ideko and the NPV of the deal using the continuation value shown here The estimated unlevered cost of capital is 12.24%. Assume that the debt cost of capital is 6.8%; Ideko's market share will increase by 0.55% per year until 2010; investment, financing, and depreciation will be adjusted accordingly; and the projected improvements in working capital e do not occur, so the numbers in the table remain at their 2005 levels through 2010 (i.e., Ideko's working capital requirements through 2010 will be as shown here ). Ideko's projected free cash flows are shown here the projected free cash flow for 2011 is $16,502,000). Ideko's projected income statements and balance sheets are shown here and here , respectively. Assume an income tax rate of 35%. The projected dividend payments for 2006 thru 2010 are shown here: Calculate the value of Ideko using the APV method below (Notice that we begin with year 2010 and work backward to year 2005.): (Round to the nearest $ 000.) 2010 2009 APV Method ($ 000) Free Cash Flow of Firm Unlevered Value of the Firm Interest Tax Shield Tax Shield Value APV Debt (2,488) 272,308 2,440 274,748 (116,600) 158,148 Equity Value 2.0 x Continuation Value: Multiples Approach ($ 000) EBITDA in 2010 29,924 EBITDA Multiple 9.1 x Continuation Enterprise Value 272,308 Debt (116,600) Continuation Equity Value 155,708 Common Multiples EV/Sales P/E (levered) P/E (unlevered) 14.9 x 18.2 x (Click on the following icon 2 in order to copy its contents into a spreadsheet.) Ideko's Working Capital Requirements Working Capital Days Assets Based on: Accounts Receivable Sales Revenue Raw Materials Raw Materials Costs Finished Goods Raw Materials + Labor Costs Minimum Cash Balance Sales Revenue Liabilities Wages Payable Direct Labor + Admin Costs Other Accounts Payable Raw Materials + Sales and Marketing 2005 Days 90 45 45 30 > 2005 Days 90 45 45 30 15 45 15 45 2005 2006 2007 2008 2009 2010 18,518 1,849 21,565 2,210 4,118 Working Capital ($ 000) Assets Accounts Receivable Raw Materials Finished Goods Minimum Cash Balance Total Current Assets Labilities Wages Payable Other Accounts Payable Total Current Liabilities Net Working Capital Increase in Net Working Capital 24,294 2,467 5,425 8,098 40,284 4,785 7,188 35,748 27,298 2,746 6,138 9,099 45,281 30,604 3,050 6,928 10,201 50,783 6,173 34,239 3,380 7,807 11,413 56,839 30,658 1,393 1,762 1,323 3,245 1,950 6,106 3,986 5,404 1,589 4,650 6,239 34,045 2,211 6,799 9,010 47,829 4,568 5,379 8,056 26,090 30,369 7,166 38, 115 4,070 42,727 4,279 3,676 4,612 5,102 2005 2006 2007 2008 2009 2010 5,591 4,531 10,122 6,225 4,531 10,756 9,528 4,531 14,059 5,521 10,439 4,531 14,970 5,659 5,608 7,458 4,531 11,989 5,562 (4,070) (5,150) 8,331 Free Cash Flow ($ 000) Net Income Plus: After-tax Interest Expense Unlevered Net Income Plus: Depreciation Less: Increase in NWC Less: Capital Expenditures Free Cash Flow of Firm Plus: Net Borrowing Less: After-tax Interest Expense Free Cash Flow to Equity 6,894 (4,279) (5,150) 6,352 (3,676) (5,150) 7,538 (4,612) (5.150) 9,818 (5,102) (19,250) (2,488) 14,100 (4,531) 7,081 (4,531) 1,821 (4,531) 3,007 (4,531) 3,800 (4,531) 5,287 2005 2006 2008 2009 2010 2007 98,525 75,100 87,460 110,710 124, 118 138,860 Income Statement ($ 000) Sales Cost of Goods Sold Raw Materials Direct Labor Costs Gross Profit Sales and Marketing Administrative EBITDA Depreciation EBIT Interest Expense (net) Pretax Income Income Tax Net Income (15,000) (18,400) 41,700 (11,320) (13,800) 16,580 (5,715) 10,865 (80) (17,928) (20,008) (22,274) (24,737) (20,882) (23,996) (27,508) (31,459) 48,650 54,521 60,928 67,922 (14,405) (17,705) (21,555) (24,786) (13,014) (14,661) (15,367) (15,986) 21,231 22,155 24,006 27,150 (5,659) (5,608) (5,562) (5,521) 15,572 16,547 18,444 21,629 (6,970) (6,970) (6,970) (6,970) 8,602 9,577 11,474 14,659 (3,011) (3,352) (4,016) (5,131) 5,591 6,225 7,458 9,528 (27,417) (35,904) 75,539 (27,730) (17,885) 29,924 (6,894) 23,030 (6,970) 16,060 (5,621) 10,439 10,785 (3,775) 7,010 2005 2006 2007 2008 2009 2010 9,099 6,173 18,518 5,967 27,298 8,098 24,294 7,892 40,284 8,884 7,188 21,565 6,995 35,748 50,926 72,262 158,936 30,658 51,435 72,262 11,413 34,239 11,187 56,839 62,041 10,201 30,604 9,978 50,783 49,685 72,262 172,730 45,281 50,056 72,262 50,468 72,262 72,262 191,142 154,355 163,014 167,599 Balance Sheet ($ 000) Assets Cash and Equivalents Accounts Receivable Inventories Total Current Assets Property, Plant and Equipment Goodwill Total Assets Liabilities and Stockholders' Equity Accounts Payable Debt Total Liabilities Stockholders' Equity Starting Stockholders' Equity Net Income Dividends Capital Contributions Total Stockholders' Equity Total Liabilities and Equity 4,568 102,500 107,068 5,379 102,500 107,879 6,239 102,500 108,739 7,166 102,500 109,666 8,056 102,500 110,556 9,010 116,600 125,610 57,933 62,174 47,287 5,591 (1,821) 51,057 6,225 (3,007) 54,275 7,458 (3,800) 9,528 10,439 (7,081) (5,287) 47,287 51,057 57,933 62,174 65,532 54,275 163,014 154,355 158,936 167,599 172,730 191,142 (Click on the following icon in order to copy its contents into a spreadsheet.) Dividends (3 000) 2006 (1,821) 2007 (3,007) 2008 (3,800) 2009 (5,287) 2010 (7,081) In 2005, your investment company has offered to buy Ideko for $52.6 million. Using the APV method, estimate the value of Ideko and the NPV of the deal using the continuation value shown here The estimated unlevered cost of capital is 12.24%. Assume that the debt cost of capital is 6.8%; Ideko's market share will increase by 0.55% per year until 2010; investment, financing, and depreciation will be adjusted accordingly; and the projected improvements in working capital e do not occur, so the numbers in the table remain at their 2005 levels through 2010 (i.e., Ideko's working capital requirements through 2010 will be as shown here ). Ideko's projected free cash flows are shown here the projected free cash flow for 2011 is $16,502,000). Ideko's projected income statements and balance sheets are shown here and here , respectively. Assume an income tax rate of 35%. The projected dividend payments for 2006 thru 2010 are shown here: Calculate the value of Ideko using the APV method below (Notice that we begin with year 2010 and work backward to year 2005.): (Round to the nearest $ 000.) 2010 2009 APV Method ($ 000) Free Cash Flow of Firm Unlevered Value of the Firm Interest Tax Shield Tax Shield Value APV Debt (2,488) 272,308 2,440 274,748 (116,600) 158,148 Equity Value 2.0 x Continuation Value: Multiples Approach ($ 000) EBITDA in 2010 29,924 EBITDA Multiple 9.1 x Continuation Enterprise Value 272,308 Debt (116,600) Continuation Equity Value 155,708 Common Multiples EV/Sales P/E (levered) P/E (unlevered) 14.9 x 18.2 x (Click on the following icon 2 in order to copy its contents into a spreadsheet.) Ideko's Working Capital Requirements Working Capital Days Assets Based on: Accounts Receivable Sales Revenue Raw Materials Raw Materials Costs Finished Goods Raw Materials + Labor Costs Minimum Cash Balance Sales Revenue Liabilities Wages Payable Direct Labor + Admin Costs Other Accounts Payable Raw Materials + Sales and Marketing 2005 Days 90 45 45 30 > 2005 Days 90 45 45 30 15 45 15 45 2005 2006 2007 2008 2009 2010 18,518 1,849 21,565 2,210 4,118 Working Capital ($ 000) Assets Accounts Receivable Raw Materials Finished Goods Minimum Cash Balance Total Current Assets Labilities Wages Payable Other Accounts Payable Total Current Liabilities Net Working Capital Increase in Net Working Capital 24,294 2,467 5,425 8,098 40,284 4,785 7,188 35,748 27,298 2,746 6,138 9,099 45,281 30,604 3,050 6,928 10,201 50,783 6,173 34,239 3,380 7,807 11,413 56,839 30,658 1,393 1,762 1,323 3,245 1,950 6,106 3,986 5,404 1,589 4,650 6,239 34,045 2,211 6,799 9,010 47,829 4,568 5,379 8,056 26,090 30,369 7,166 38, 115 4,070 42,727 4,279 3,676 4,612 5,102 2005 2006 2007 2008 2009 2010 5,591 4,531 10,122 6,225 4,531 10,756 9,528 4,531 14,059 5,521 10,439 4,531 14,970 5,659 5,608 7,458 4,531 11,989 5,562 (4,070) (5,150) 8,331 Free Cash Flow ($ 000) Net Income Plus: After-tax Interest Expense Unlevered Net Income Plus: Depreciation Less: Increase in NWC Less: Capital Expenditures Free Cash Flow of Firm Plus: Net Borrowing Less: After-tax Interest Expense Free Cash Flow to Equity 6,894 (4,279) (5,150) 6,352 (3,676) (5,150) 7,538 (4,612) (5.150) 9,818 (5,102) (19,250) (2,488) 14,100 (4,531) 7,081 (4,531) 1,821 (4,531) 3,007 (4,531) 3,800 (4,531) 5,287 2005 2006 2008 2009 2010 2007 98,525 75,100 87,460 110,710 124, 118 138,860 Income Statement ($ 000) Sales Cost of Goods Sold Raw Materials Direct Labor Costs Gross Profit Sales and Marketing Administrative EBITDA Depreciation EBIT Interest Expense (net) Pretax Income Income Tax Net Income (15,000) (18,400) 41,700 (11,320) (13,800) 16,580 (5,715) 10,865 (80) (17,928) (20,008) (22,274) (24,737) (20,882) (23,996) (27,508) (31,459) 48,650 54,521 60,928 67,922 (14,405) (17,705) (21,555) (24,786) (13,014) (14,661) (15,367) (15,986) 21,231 22,155 24,006 27,150 (5,659) (5,608) (5,562) (5,521) 15,572 16,547 18,444 21,629 (6,970) (6,970) (6,970) (6,970) 8,602 9,577 11,474 14,659 (3,011) (3,352) (4,016) (5,131) 5,591 6,225 7,458 9,528 (27,417) (35,904) 75,539 (27,730) (17,885) 29,924 (6,894) 23,030 (6,970) 16,060 (5,621) 10,439 10,785 (3,775) 7,010 2005 2006 2007 2008 2009 2010 9,099 6,173 18,518 5,967 27,298 8,098 24,294 7,892 40,284 8,884 7,188 21,565 6,995 35,748 50,926 72,262 158,936 30,658 51,435 72,262 11,413 34,239 11,187 56,839 62,041 10,201 30,604 9,978 50,783 49,685 72,262 172,730 45,281 50,056 72,262 50,468 72,262 72,262 191,142 154,355 163,014 167,599 Balance Sheet ($ 000) Assets Cash and Equivalents Accounts Receivable Inventories Total Current Assets Property, Plant and Equipment Goodwill Total Assets Liabilities and Stockholders' Equity Accounts Payable Debt Total Liabilities Stockholders' Equity Starting Stockholders' Equity Net Income Dividends Capital Contributions Total Stockholders' Equity Total Liabilities and Equity 4,568 102,500 107,068 5,379 102,500 107,879 6,239 102,500 108,739 7,166 102,500 109,666 8,056 102,500 110,556 9,010 116,600 125,610 57,933 62,174 47,287 5,591 (1,821) 51,057 6,225 (3,007) 54,275 7,458 (3,800) 9,528 10,439 (7,081) (5,287) 47,287 51,057 57,933 62,174 65,532 54,275 163,014 154,355 158,936 167,599 172,730 191,142 (Click on the following icon in order to copy its contents into a spreadsheet.) Dividends (3 000) 2006 (1,821) 2007 (3,007) 2008 (3,800) 2009 (5,287) 2010 (7,081)


