Answered step by step
Verified Expert Solution
Link Copied!

Question

1 Approved Answer

In 2010, the Maricopa Community College District's enrollment data showed the following breakdown of students by ethnicity: 54.8% White; 21.1% Hispanic; 7.9% Black; 4.5% Asian/Pacific

In 2010, the Maricopa Community College District's enrollment data showed the following breakdown of students by ethnicity: 54.8% White; 21.1% Hispanic; 7.9% Black; 4.5% Asian/Pacific Islander; 2.9% Native American; 8.8% Other. Information was collected from a random sample 0f 300 students in 2017 to determine whether or not the data has changed significantly. The sample data is given in the table below. At the? = 0.10

level of significance, test the claim that the ethnic breakdown of students at MCCCD has not changed significantly since 2010.
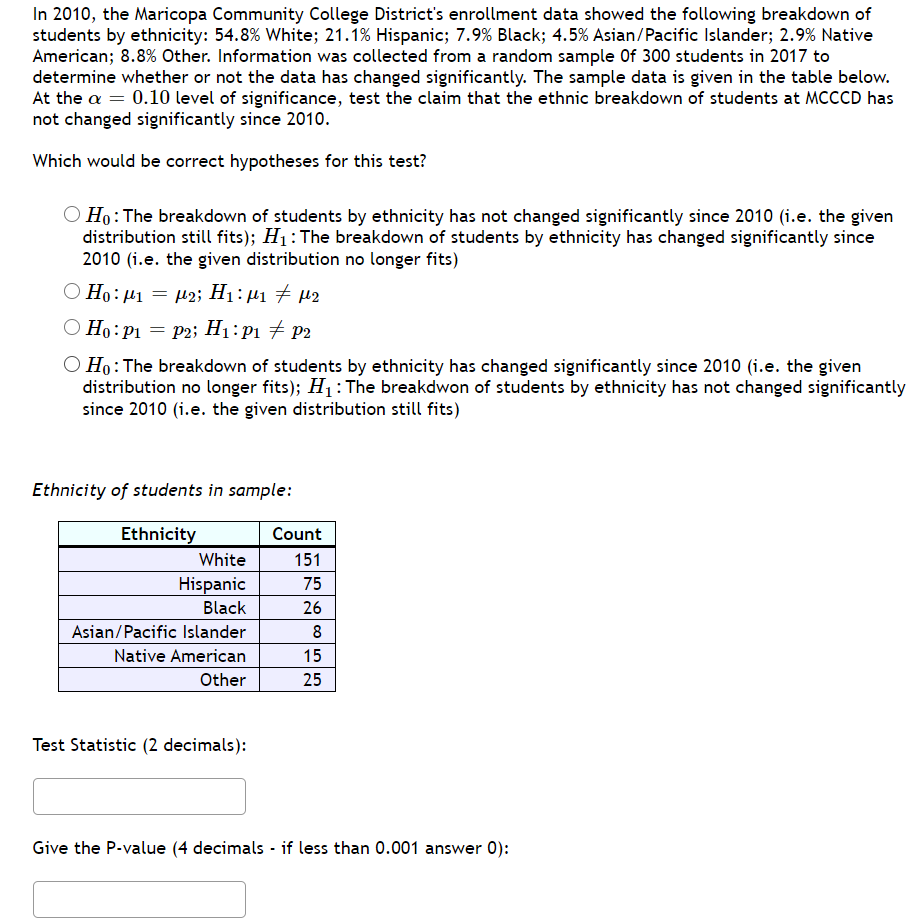
image text in transcribed
In 2010, the Maricopa Community College District's enrollment data showed the following breakdown of students by ethnicity: 54.3% White; 21.196 Hispanic; 2.9% Black; 4.5% Asianr'P'acific Islander; 2.9% Native American; 3.8% Other. Information was collected from a random sample Of 300 students in 2017 to determine whether or not the data has changed significantly. The sample data is given in the table below. At the a = 0.10 level of significance, test the claim that the ethnic breakdown of students at MCCCD has not changed significantly since 2010. Which would be correct hypotheses for this test? 0 H0 : The breakdown of students by ethnicity has not changed significantly since 2010 (i.e. the given distribution still fits]; H1 :The breakdown of students by ethnicity has changed significantly since 2010 {i.e. the given distribution no longer fits} OHDIM = #2; H1101 7'5 #2 OHo=p1 = p2;H1=pl 75 P2 0 H0 : The breakdown of students by ethnicity has changed significantly since 2010 (i.e. the given distribution no longer fits); H1 : The breakdwon of students by ethnicity has not changed significantly since 2010 (i.e. the given distribution still fits) Ethnicity of students in sample: Count Hispanic 75 Black 26 Asian J Pacific Islander 8 Native American 1 5 Other 25 Test Statistic {2 decimals): lJ Give the P-value (4 decimals - if less than 0.001 answer 0}

Step by Step Solution

There are 3 Steps involved in it

Step: 1

blur-text-image

Get Instant Access to Expert-Tailored Solutions

See step-by-step solutions with expert insights and AI powered tools for academic success

Step: 2

blur-text-image

Step: 3

blur-text-image

Ace Your Homework with AI

Get the answers you need in no time with our AI-driven, step-by-step assistance

Get Started

Recommended Textbook for

Advanced Engineering Mathematics

Authors: ERWIN KREYSZIG

9th Edition

0471488852, 978-0471488859

More Books

Students also viewed these Mathematics questions

Question

2. Define the nominal exchange rate and the real exchange rate.

Answered: 1 week ago