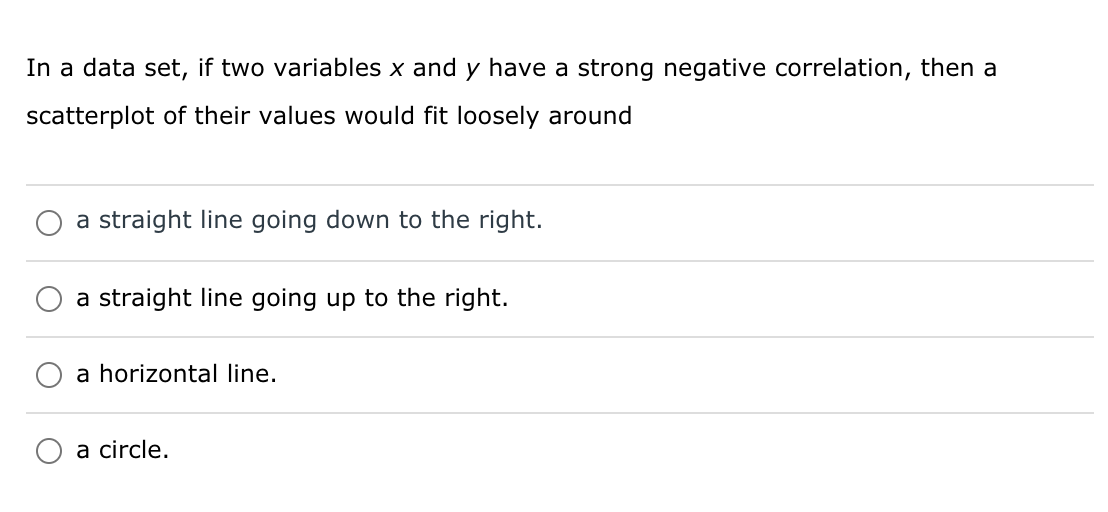
In a data set, if two variables x and y have a strong negative correlation, then a scatterplot of their values would fit loosely around
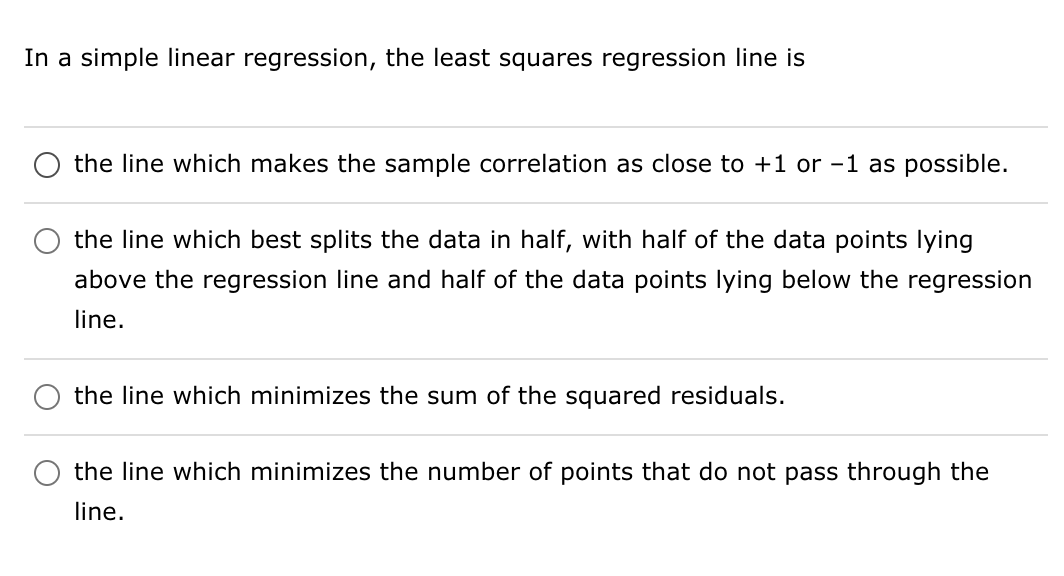
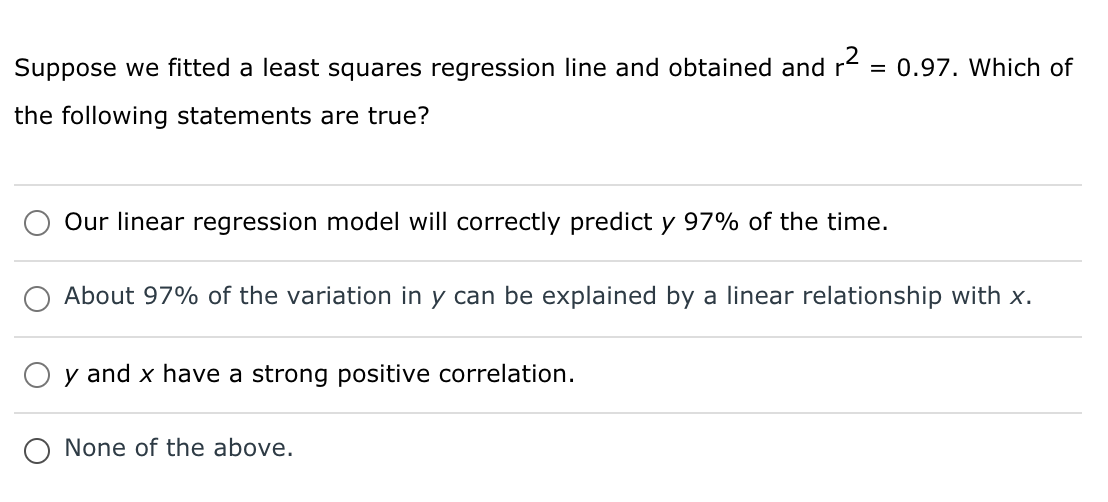
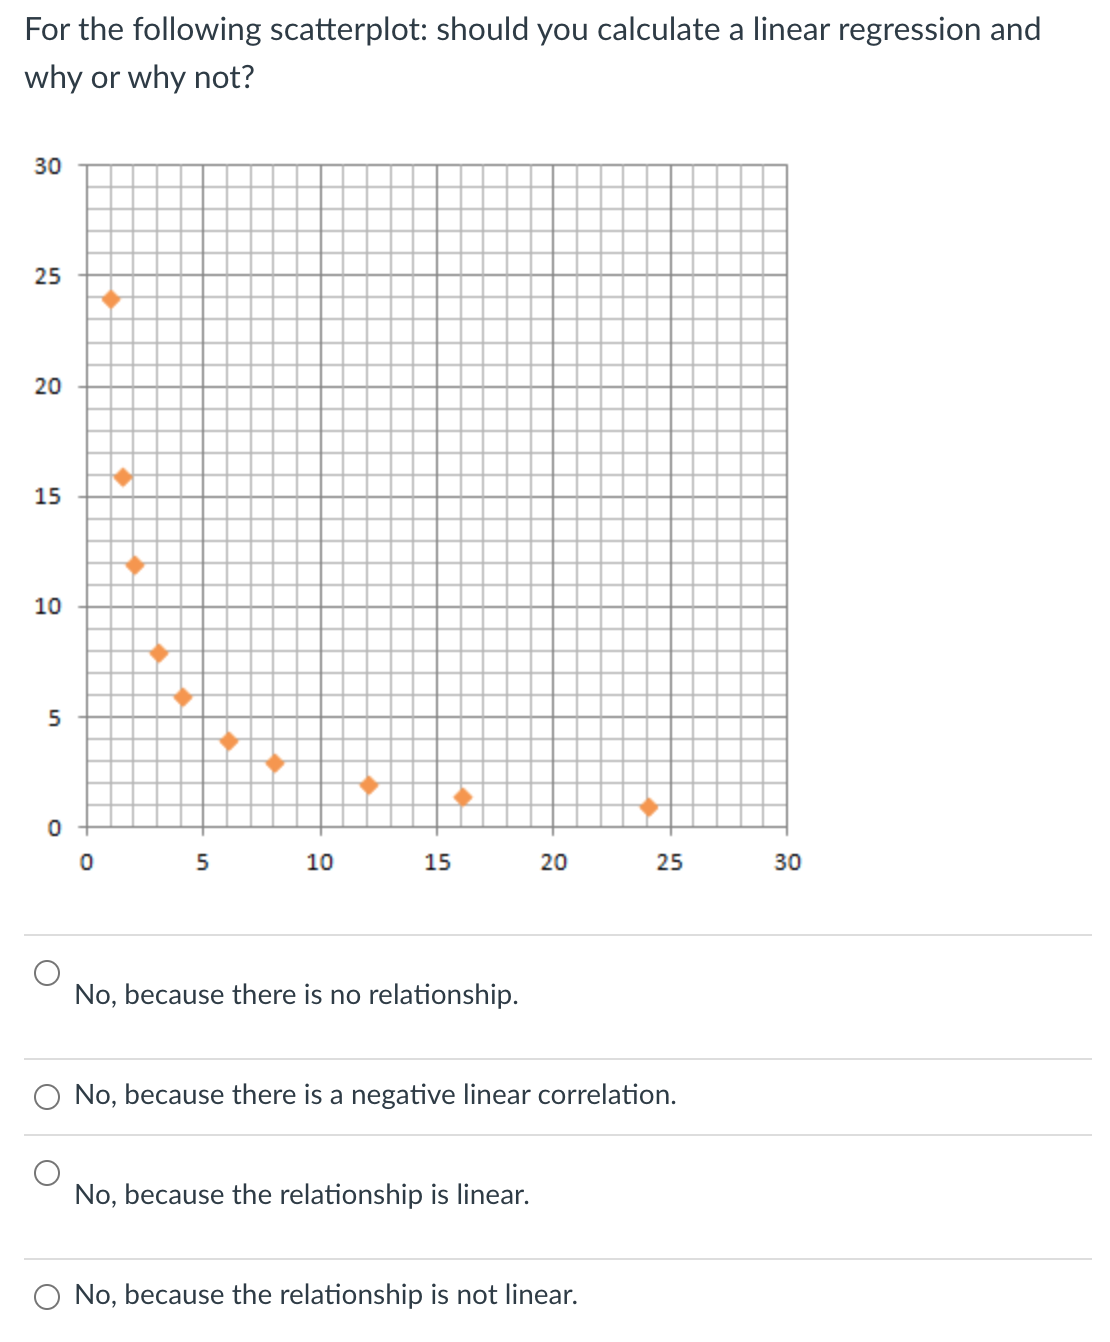
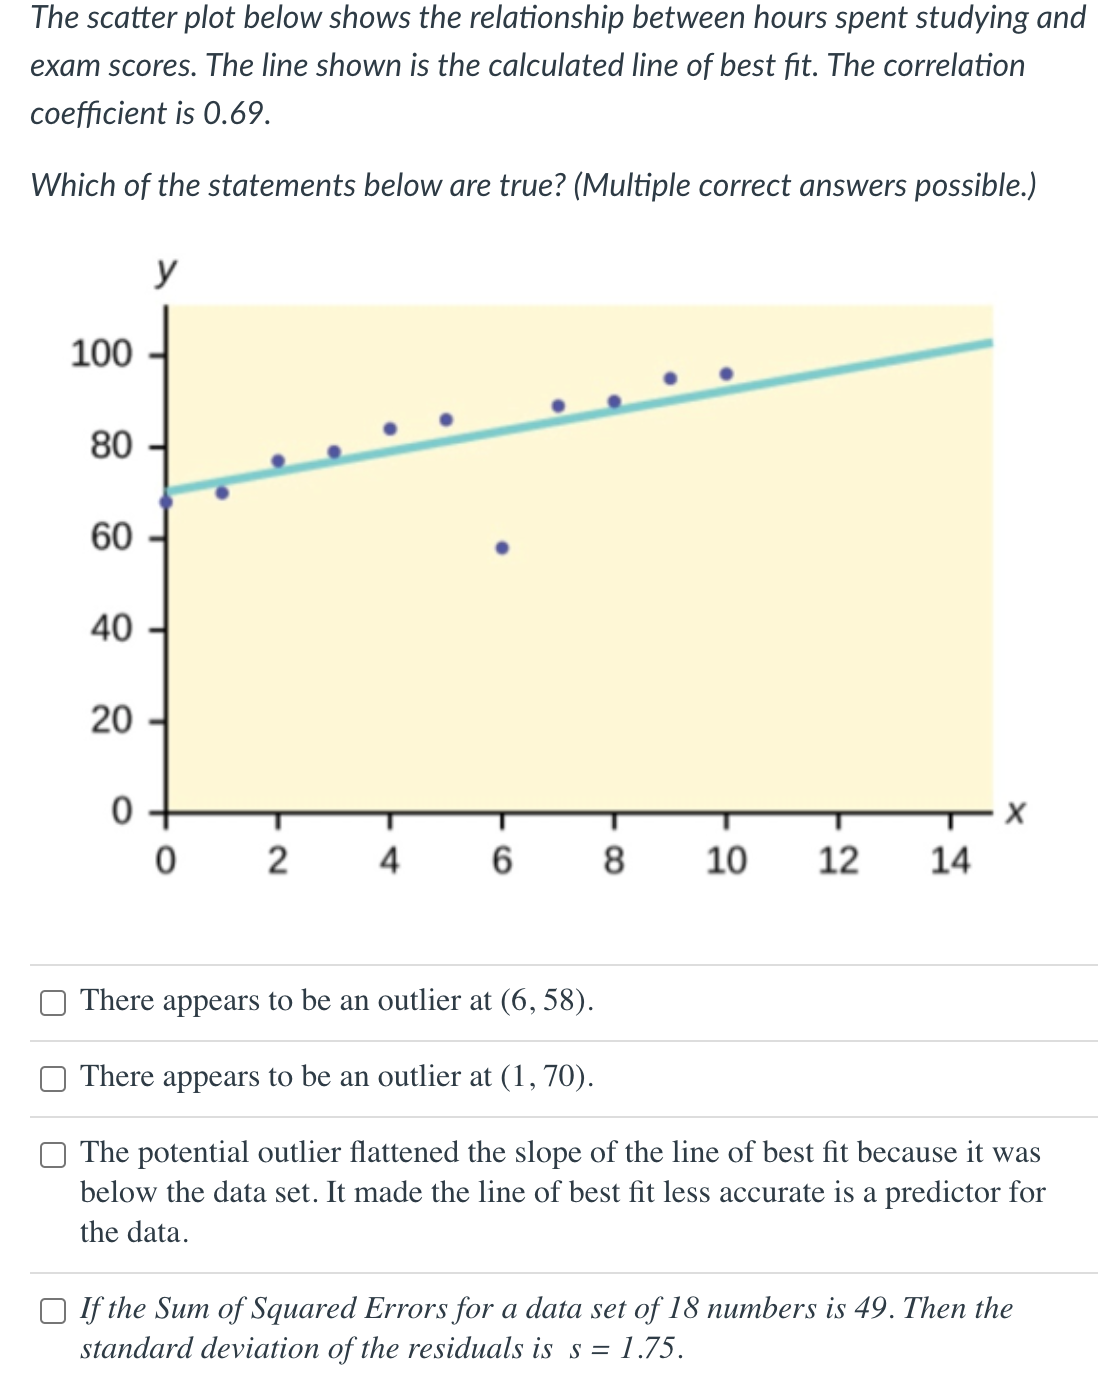
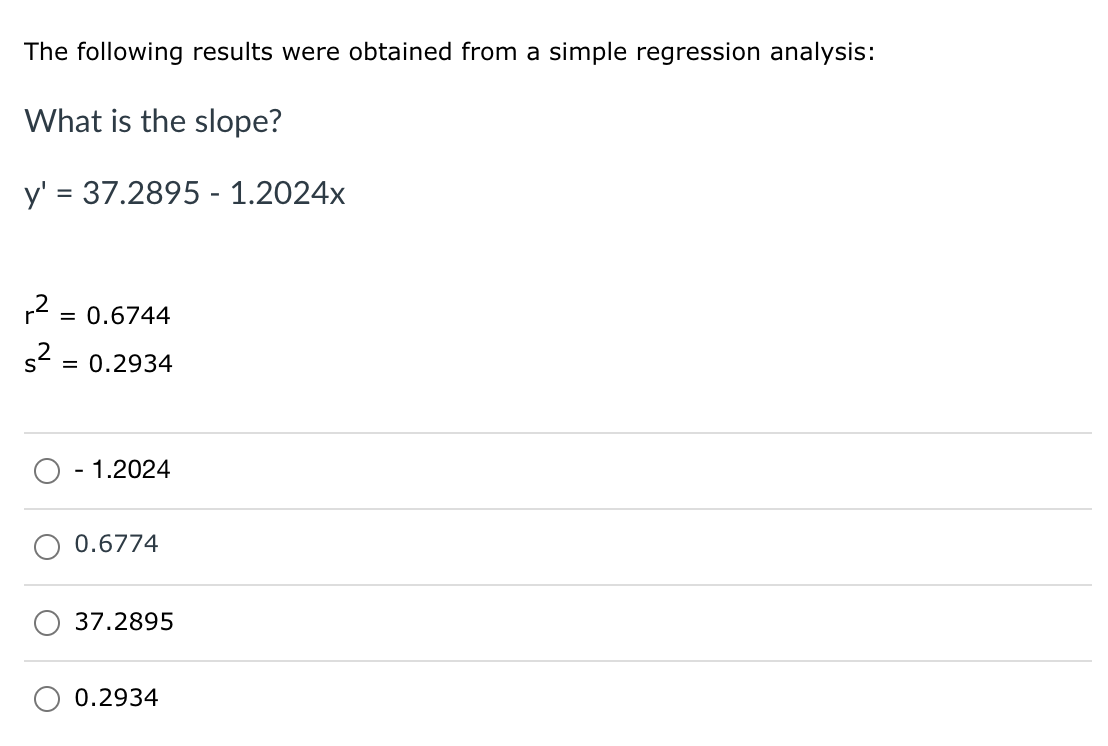
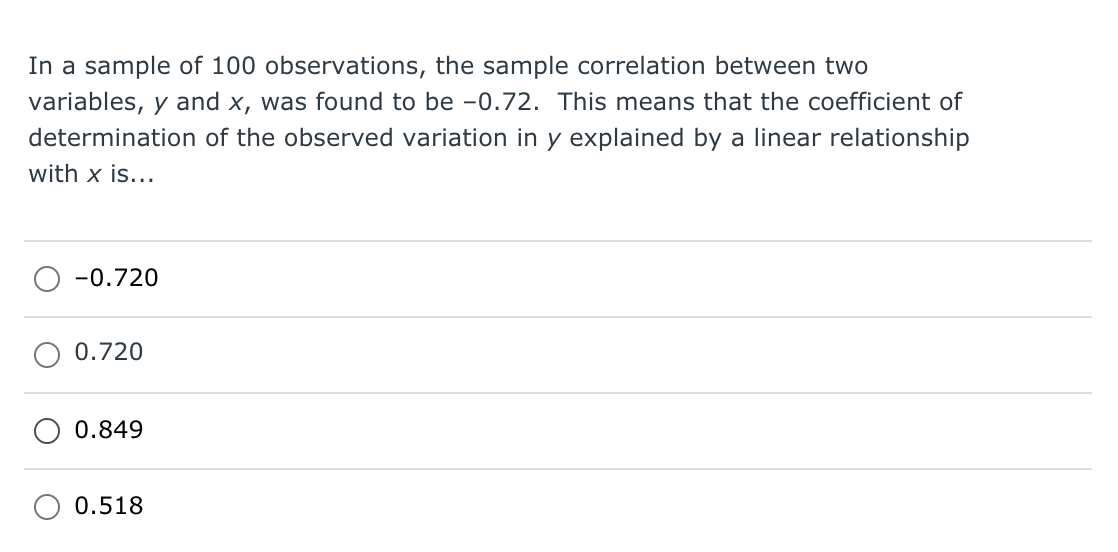
In a data set, if two variables x and y have a strong negative correlation, then a scatterplot of their values would fit loosely around 0 a straight line going down to the right. 0 a straight line going up to the right. 0 a horizontal line. C) a circle. In a simple linear regression, the least squares regression line is O the line which makes the sample correlation as close to +1 or 1 as possible. 0 the line which best splits the data in half, with half of the data points lying above the regression line and half of the data points lying below the regression line. 0 the line which minimizes the sum of the squared residuals. O the line which minimizes the number of points that do not pass through the line. For the following scatterplot: should you calculate a linear regression and why or why not? 30 25 20 15 10 5 0 0 5 10 15 20 25 30 O No, because there is no relationship. O No, because there is a negative linear correlation. O No, because the relationship is linear. O No, because the relationship is not linear.The scatter plot below shows the relationship between hours spent studying and exam scores. The line shown is the calculated line of best t. The correlation coefcient is 0.69. Which of the statements below are true? {Multiple correct answers possible.) Y C] There appears to be an outlier at (6, 58). C] There appears to be an outlier at (1, 70). C] The potential outlier attened the slope of the line of best t because it was below the data set. It made the line of best t less accurate is a predictor for the data. C] If the Sum of Squared Errors for a data set 0f18 numbers is 49. Then the standard deviation of the residuals is s = 1.75. C] If the Sum of Squared Errors for a data set 0f18 numbers is 49. Then the standard deviation of the residuals is s = 1.55. The following results were obtained from a simple regression analysis: What is the slope? y' = 37.2895 - 1.2024): r2 = 0.6744 52 = 0.2934 0 - 1.2024 0 0.6774 0 37.2895 0 0.2934 Suppose we fitted a least squares regression line and obtained and r2 = 0.97. Which of the following statements are true? 0 Our linear regression model will correctly predict y 97% of the time. 0 About 97% of the variation in y can be explained by a linear relationship with x. O y and x have a strong positive correlation. 0 None of the above. In a sample of 100 observations, the sample correlation between two variables, y and x, was found to be -0.72. This means that the coefficient of determination of the observed variation in y explained by a linear relationship with x is... O -0.720 O 0.720 O 0.349 O 0.518
Step by Step Solution
There are 3 Steps involved in it
Step: 1
Get Instant Access to Expert-Tailored Solutions
See step-by-step solutions with expert insights and AI powered tools for academic success
Step: 2
Step: 3
Ace Your Homework with AI
Get the answers you need in no time with our AI-driven, step-by-step assistance