Answered step by step
Verified Expert Solution
Question
1 Approved Answer
In a forest in Alberta, every year 85% of the population of red deer either die of natural causes or are eaten by predators.


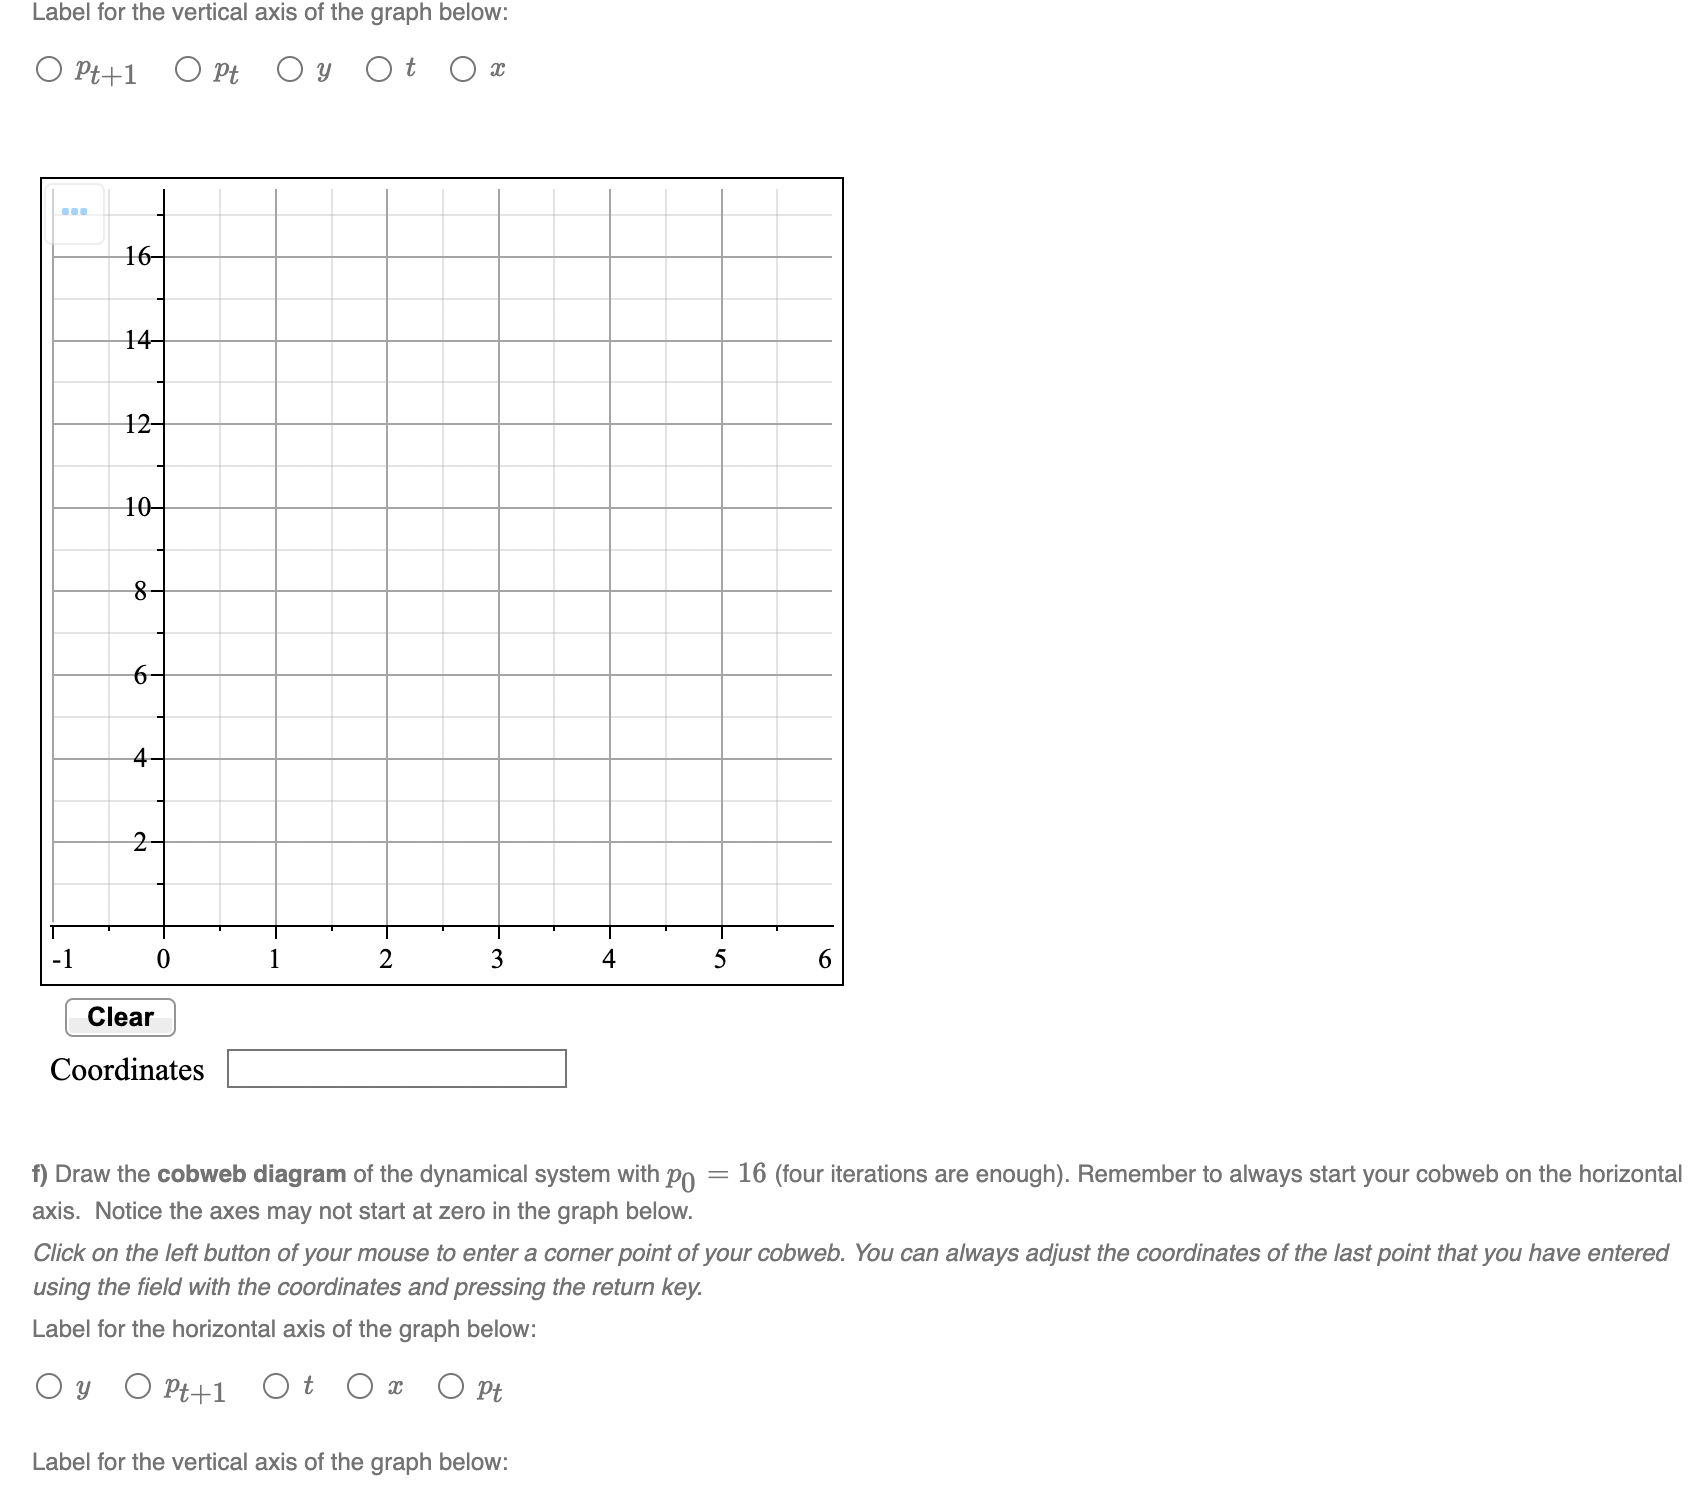
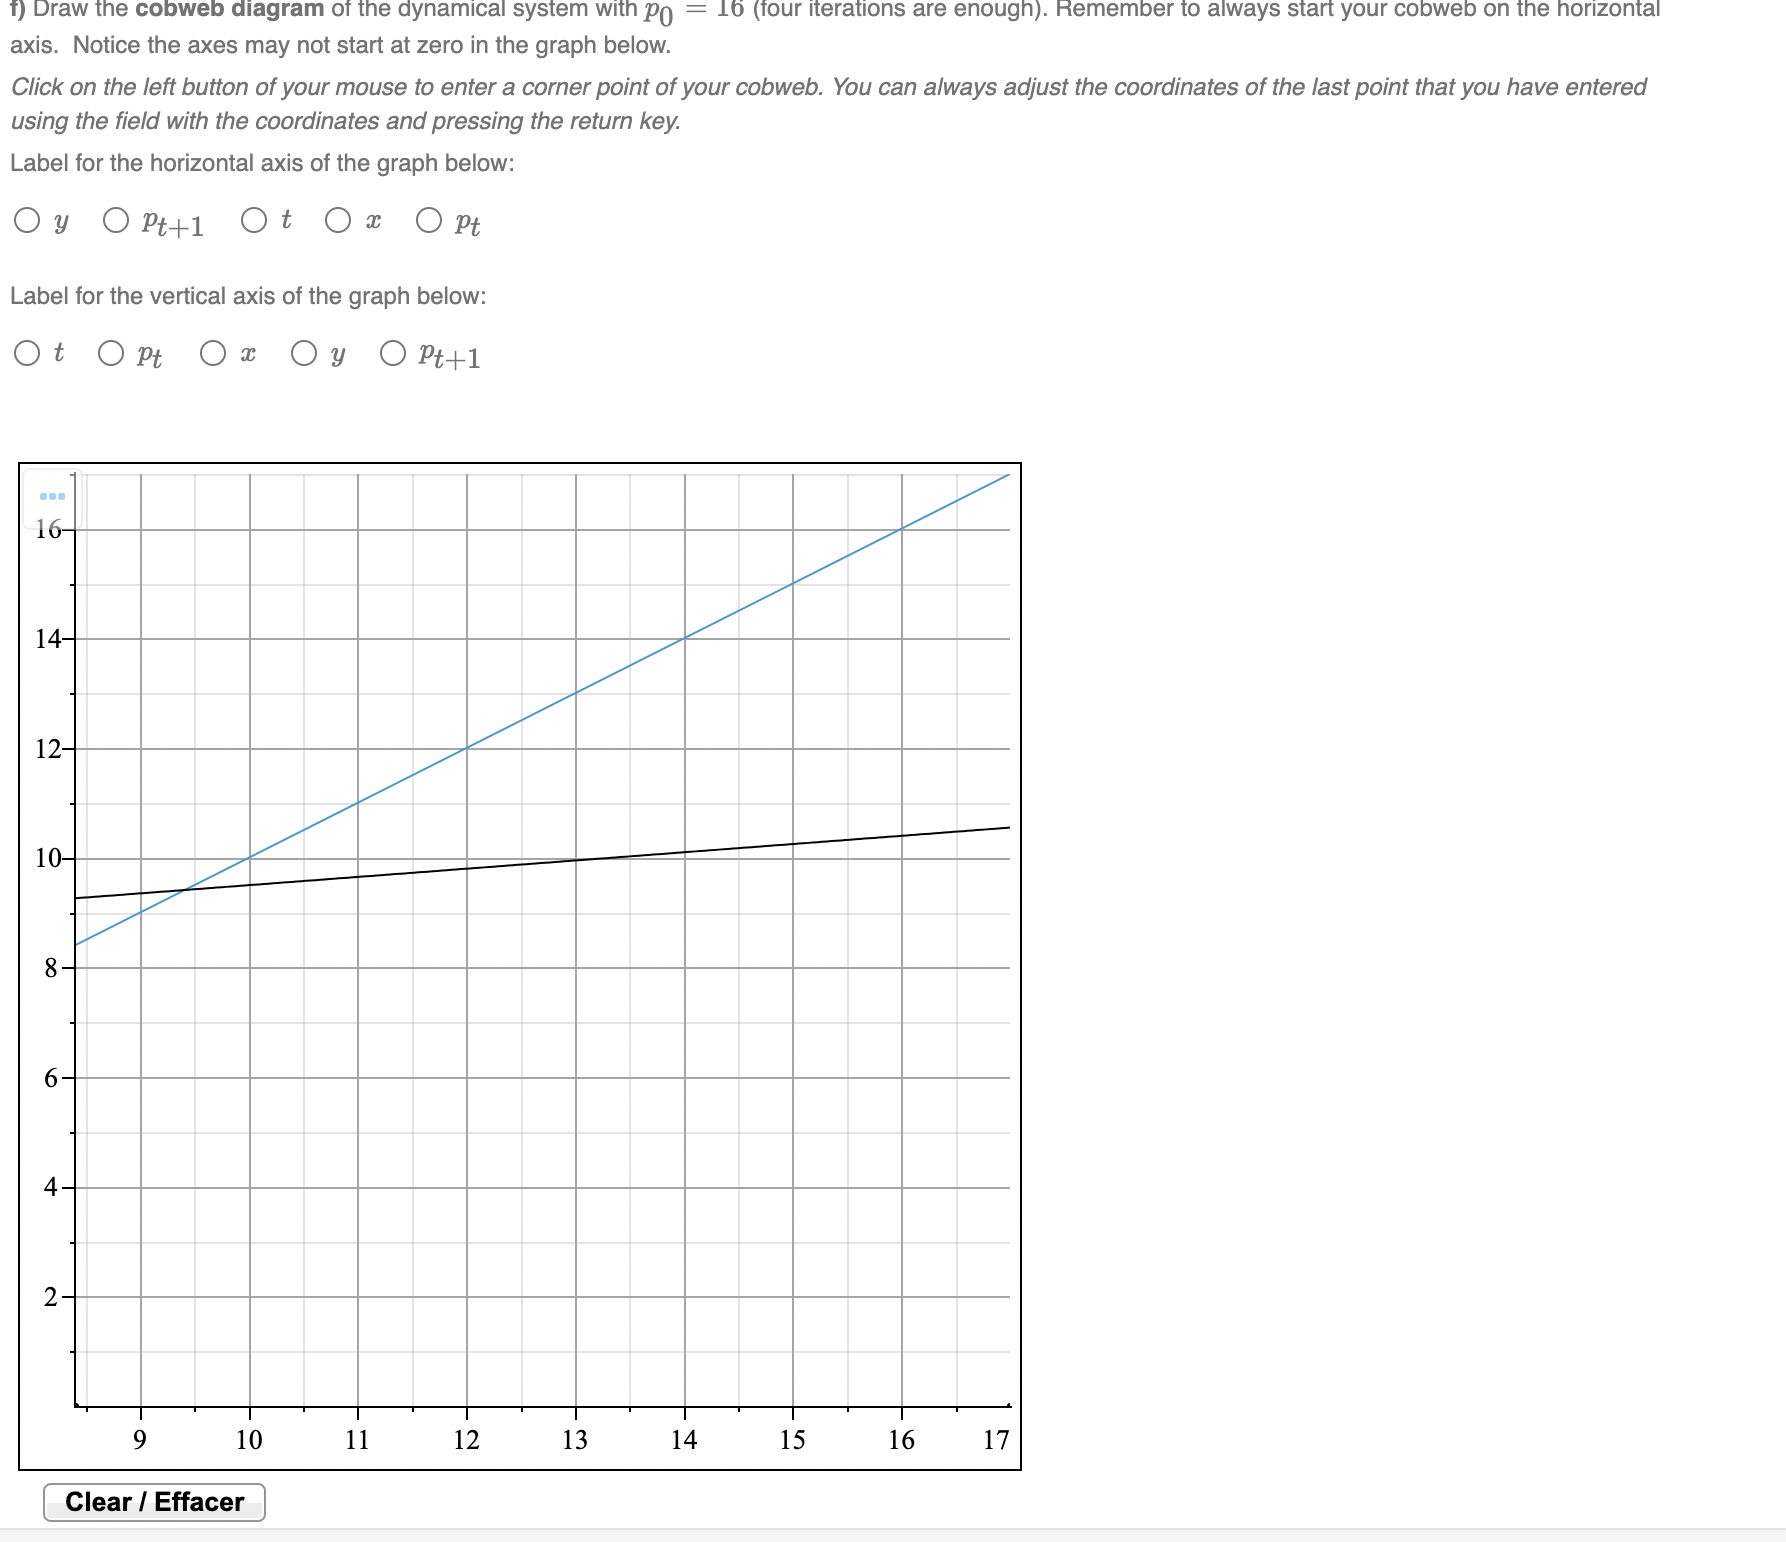
In a forest in Alberta, every year 85% of the population of red deer either die of natural causes or are eaten by predators. In the meantime, there are 8 new red deer per square kilometer. The discrete-time dynamical system (DTDS) that gives the population of red deer per square kilometer each year is Pt+1 = 0.15pt + 8 (Can you justify why it is the DTDS?) a) If there are 16 red deer per square kilometer now, how many red deer per square kilometer will there be in three years? Give your answer as a decimal with an accuracy of two decimal places. Answer: 9.43 b) Give the updating function f of the dynamical system, written as a function of a variable . f(x) = .15*x+8 Find its inverse, also written as a function of a variable x, if it exists. Write none if the inverse function doesn't exist. -(x) = c) Determine the equilibrium point p* of this dynamical system. Give exact values, not decimals; for instance, 2; 7; 7/3. d) Find the general solution of the dynamical system (ie., a formula in terms of t) given the initial condition po = 16. Use exact values, not decimals. Pt = e) Graph the points of the solution of the discrete time dynamical system with po = 16 (four values in addition to the initial condition are enough). Click on the left button of your mouse to enter point of your graph. You can always adjust the coordinates of the last point that you have entered using the field with the coordinates and pressing the return key. Label for the horizontal axis of the graph below: O Pt+1 O x Ot O pt Oy Label for the vertical axis of the graph below: O Pt+1 O Pt Oy Ot Ox Label for the vertical axis of the graph below: O Pt+1 pt Ot Ox -1 16- 14- 12- 10- 8 6 4 2 0 Clear Coordinates 1 2 3 4 f) Draw the cobweb diagram of the dynamical system with po axis. Notice the axes may not start at zero in the graph below. Label for the vertical axis of the graph below: 5 Click on the left button of your mouse to enter a corner point of your cobweb. You can always adjust the coordinates of the last point that you have entered using the field with dinates and pressing the return key. Label for the horizontal axis of the graph below: O Pt Oy O Pt+1 Ot Ox 6 = 16 (four iterations are enough). Remember to always start your cobweb on the horizontal f) Draw the cobweb diagram of the dynamical system with Po = 16 (four iterations are enough). Remember to always start your cobweb on the horizontal axis. Notice the axes may not start at zero in the graph below. Click on the left button of your mouse to enter a corner point of your cobweb. You can always adjust the coordinates of the last point that you have entered using the field with the coordinates and pressing the return key. Label for the horizontal axis of the graph below: Oy O Pt+1 Ot 0 x Opt Label for the vertical axis of the graph below: Ot Opt Ox Oy Pt+1 16- 14- 12- 10- 8 15 6 2. 9 10 Clear / Effacer 11 12 13 14 15 16 17
Step by Step Solution
There are 3 Steps involved in it
Step: 1

Get Instant Access to Expert-Tailored Solutions
See step-by-step solutions with expert insights and AI powered tools for academic success
Step: 2

Step: 3

Ace Your Homework with AI
Get the answers you need in no time with our AI-driven, step-by-step assistance
Get Started


