Answered step by step
Verified Expert Solution
Question
1 Approved Answer
In a random sample of 220 potential voters registered in the state of Maryland, 86 indicated that they planned to vote in the next

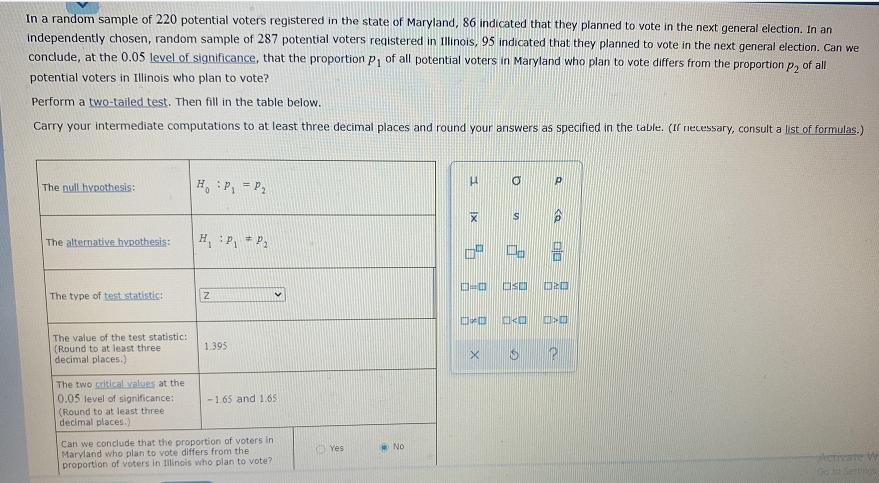
In a random sample of 220 potential voters registered in the state of Maryland, 86 indicated that they planned to vote in the next general election. In an independently chosen, random sample of 287 potential voters registered in Illinois, 95 indicated that they planned to vote in the next general election. Can we conclude, at the 0.05 level of significance, that the proportion p, of all potential voters in Maryland who plan to vote differs from the proportion p, of all potential voters in Illinois who plan to vote? Perform a two-tailed test. Then fill in the table below. Carry your intermediate computations to at least three decimal places and round your answers as specified in the table. (If riecessary, consult a list of formulas.) The null hypothesis: H, :P, = P, The alternative hypothesis: d = la: 'H The type of test statistic: The value of the test statistic: (Round to at least three decimal places.) 1.395 The two gritical values at the 0.05 level of significance: (Round to at least three decimal places.) -165 and 1.65 Can we conclude that the proportion of voters in Marvland who plan to vote differs from the proportion of voters in Iilinois who plan to vote? O Yes No o
Step by Step Solution
★★★★★
3.31 Rating (154 Votes )
There are 3 Steps involved in it
Step: 1

Get Instant Access to Expert-Tailored Solutions
See step-by-step solutions with expert insights and AI powered tools for academic success
Step: 2

Step: 3

Ace Your Homework with AI
Get the answers you need in no time with our AI-driven, step-by-step assistance
Get Started


