

Answered step by step
Verified Expert Solution
Question
1 Approved Answer
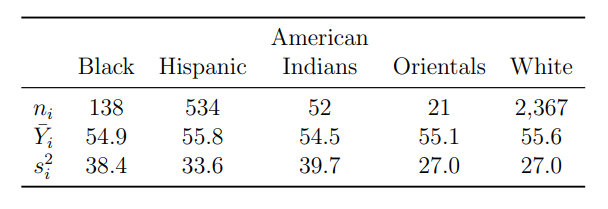
In a study of school attitude, fifth-grade students representing five ethnic groups from twenty-six school districts in Colorado were compared. The following table is the
In a study of school attitude, fifth-grade students representing five ethnic groups from twenty-six school districts in Colorado were compared. The following table is the summary statistics for the study.
Step by Step Solution
There are 3 Steps involved in it
Step: 1

Get Instant Access to Expert-Tailored Solutions
See step-by-step solutions with expert insights and AI powered tools for academic success
Step: 2

Step: 3
Ace Your Homework with AI
Get the answers you need in no time with our AI-driven, step-by-step assistance
Get Started
Differential Equations and Linear Algebra
Authors: Jerry Farlow, James E. Hall, Jean Marie McDill, Beverly H. West
2nd edition