

Question
In a study reported in Computers in Human Behavior (Facebook and Academic Performance, 2010), researchers investigated the relationship between college GPA and Facebook use. One
In a study reported in Computers in Human Behavior ("Facebook and Academic Performance", 2010), researchers investigated the relationship between college GPA and Facebook use. One question the researchers were hoping to answer was whether the "average" college GPA for students who use Facebook is lower than the "average" college GPA for students who do not use Facebook. Two samples (141 students who were Facebook users and 68 students who were not Facebook users) were independently selected from students at a large, public Midwestern university. The data in the facebook data set are not exactly the same as in the article, but are very similar. Use the data in this data set to answer the following questions.
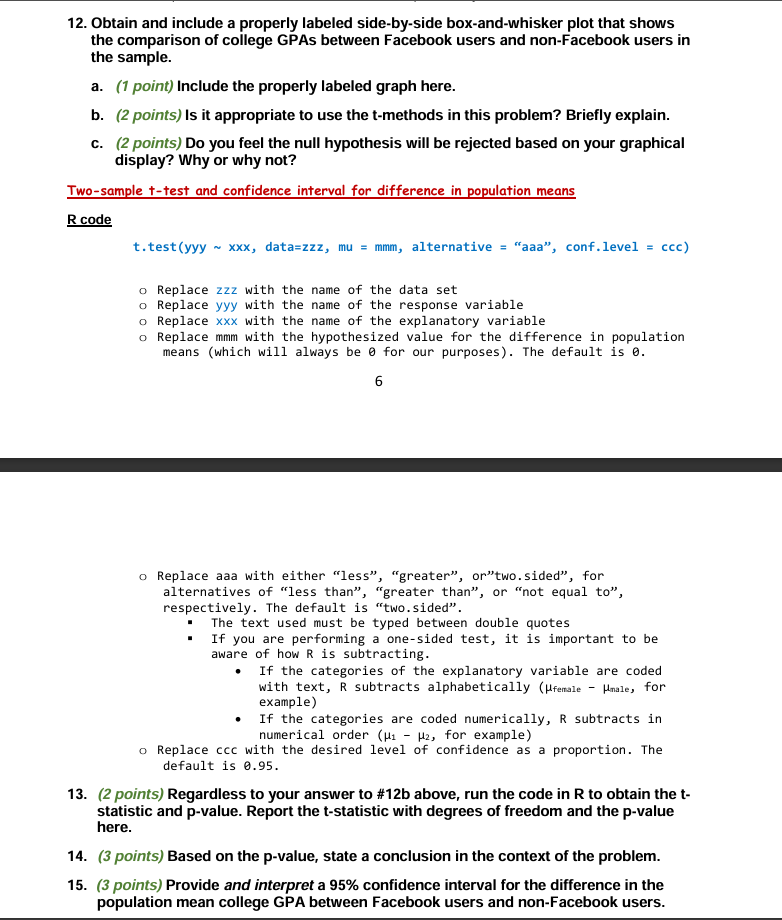
13. (2 points) Regardless to your answer to #12b above, run the code in R to obtain the t statistic and p-value. Report the t-statistic with degrees of freedom and the p-value here.
*I ran a "less" conf.level = 0.95.....
"less" conf.level = 0.95
data: GPA by user
t = 6.9847, df = 158.03, p-value = 1
alternative hypothesis: true difference in means between group No and group Yes is less than 0
95 percent confidence interval:
-Inf 0.6657149
sample estimates: mean in group No mean in group Yes
3.623824 3.085603
And also ran a "two.sided" conf.level = 0.95
data: GPA by user
t = 6.9847, df = 158.03, p-value = 7.492e-11
alternative hypothesis: true difference in means between group No and group Yes is not equal to 0
95 percent confidence interval:
0.3860271 0.6904143
sample estimates:
mean in group No mean in group Yes
3.623824 3.085603
I am confused by the question 13. above. Which t-statistic with degrees of freedom and the p-value should I use?
Step by Step Solution
There are 3 Steps involved in it
Step: 1

Get Instant Access to Expert-Tailored Solutions
See step-by-step solutions with expert insights and AI powered tools for academic success
Step: 2

Step: 3
Ace Your Homework with AI
Get the answers you need in no time with our AI-driven, step-by-step assistance
Get Started
Probability and Stochastic Processes A Friendly Introduction for Electrical and Computer Engineers
Authors: Roy D. Yates, David J. Goodman
3rd edition
1118324560, 978-1118324561