In an experiment to study an oral rinse designed to prevent plaque buildup, subjects were divided into two groupsone group used a rinse with an
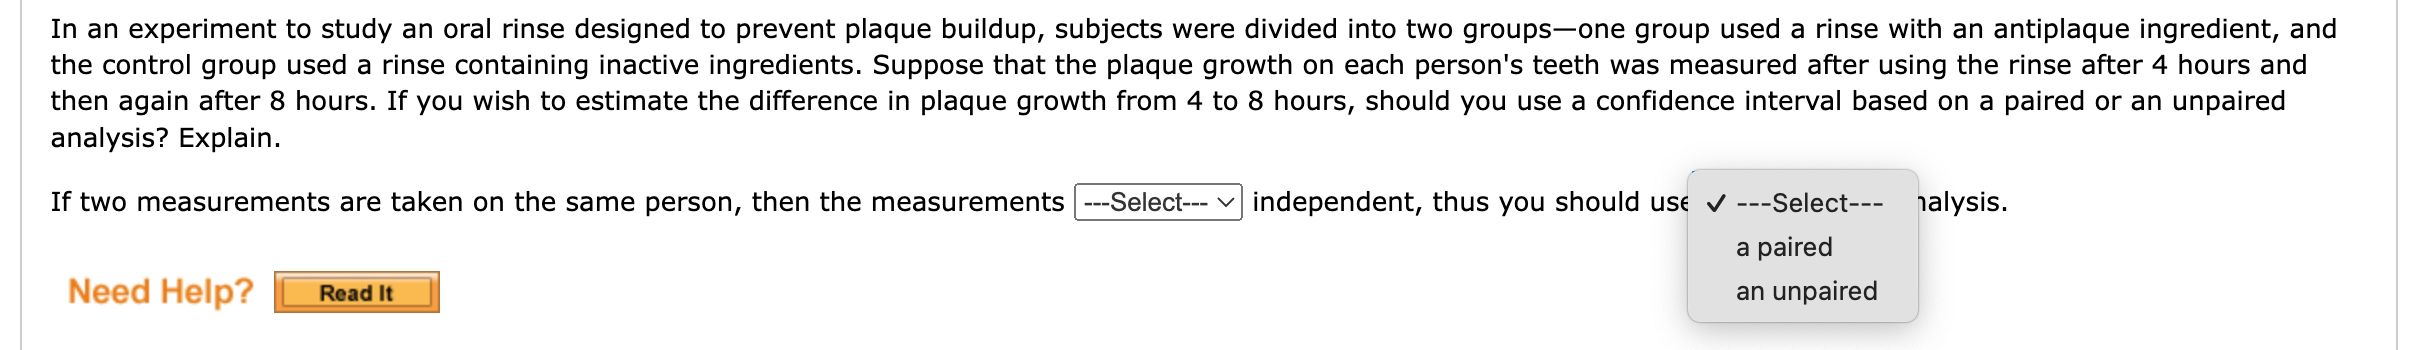
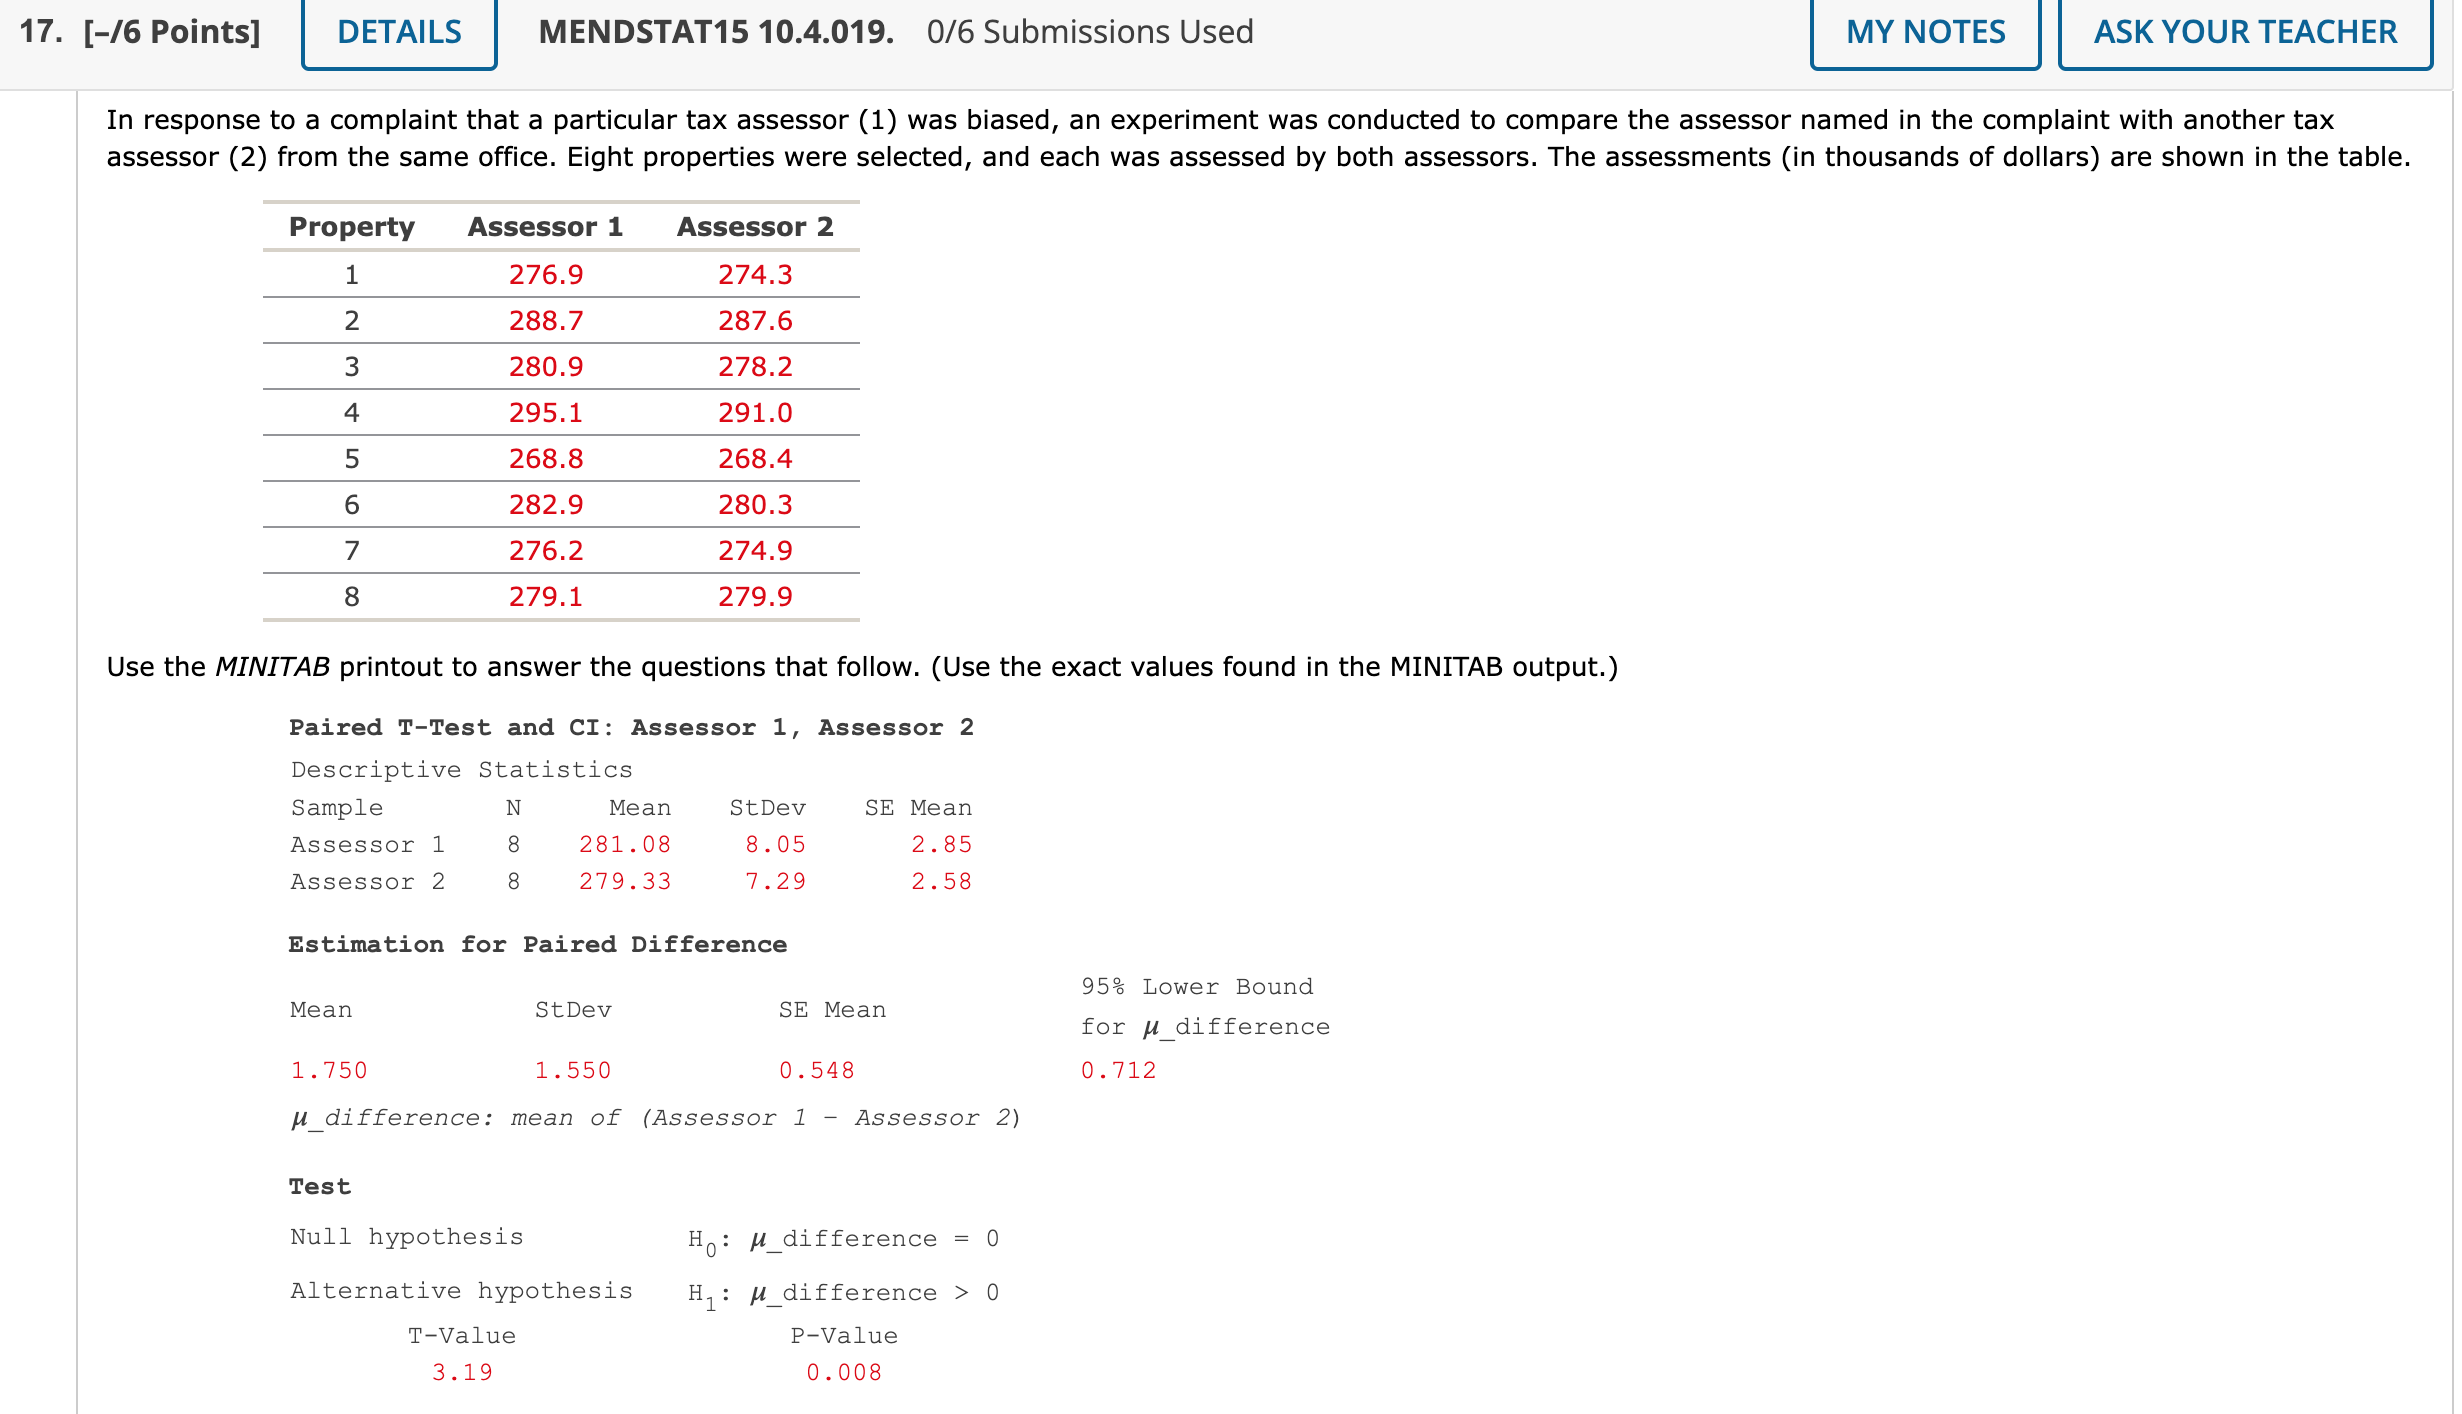
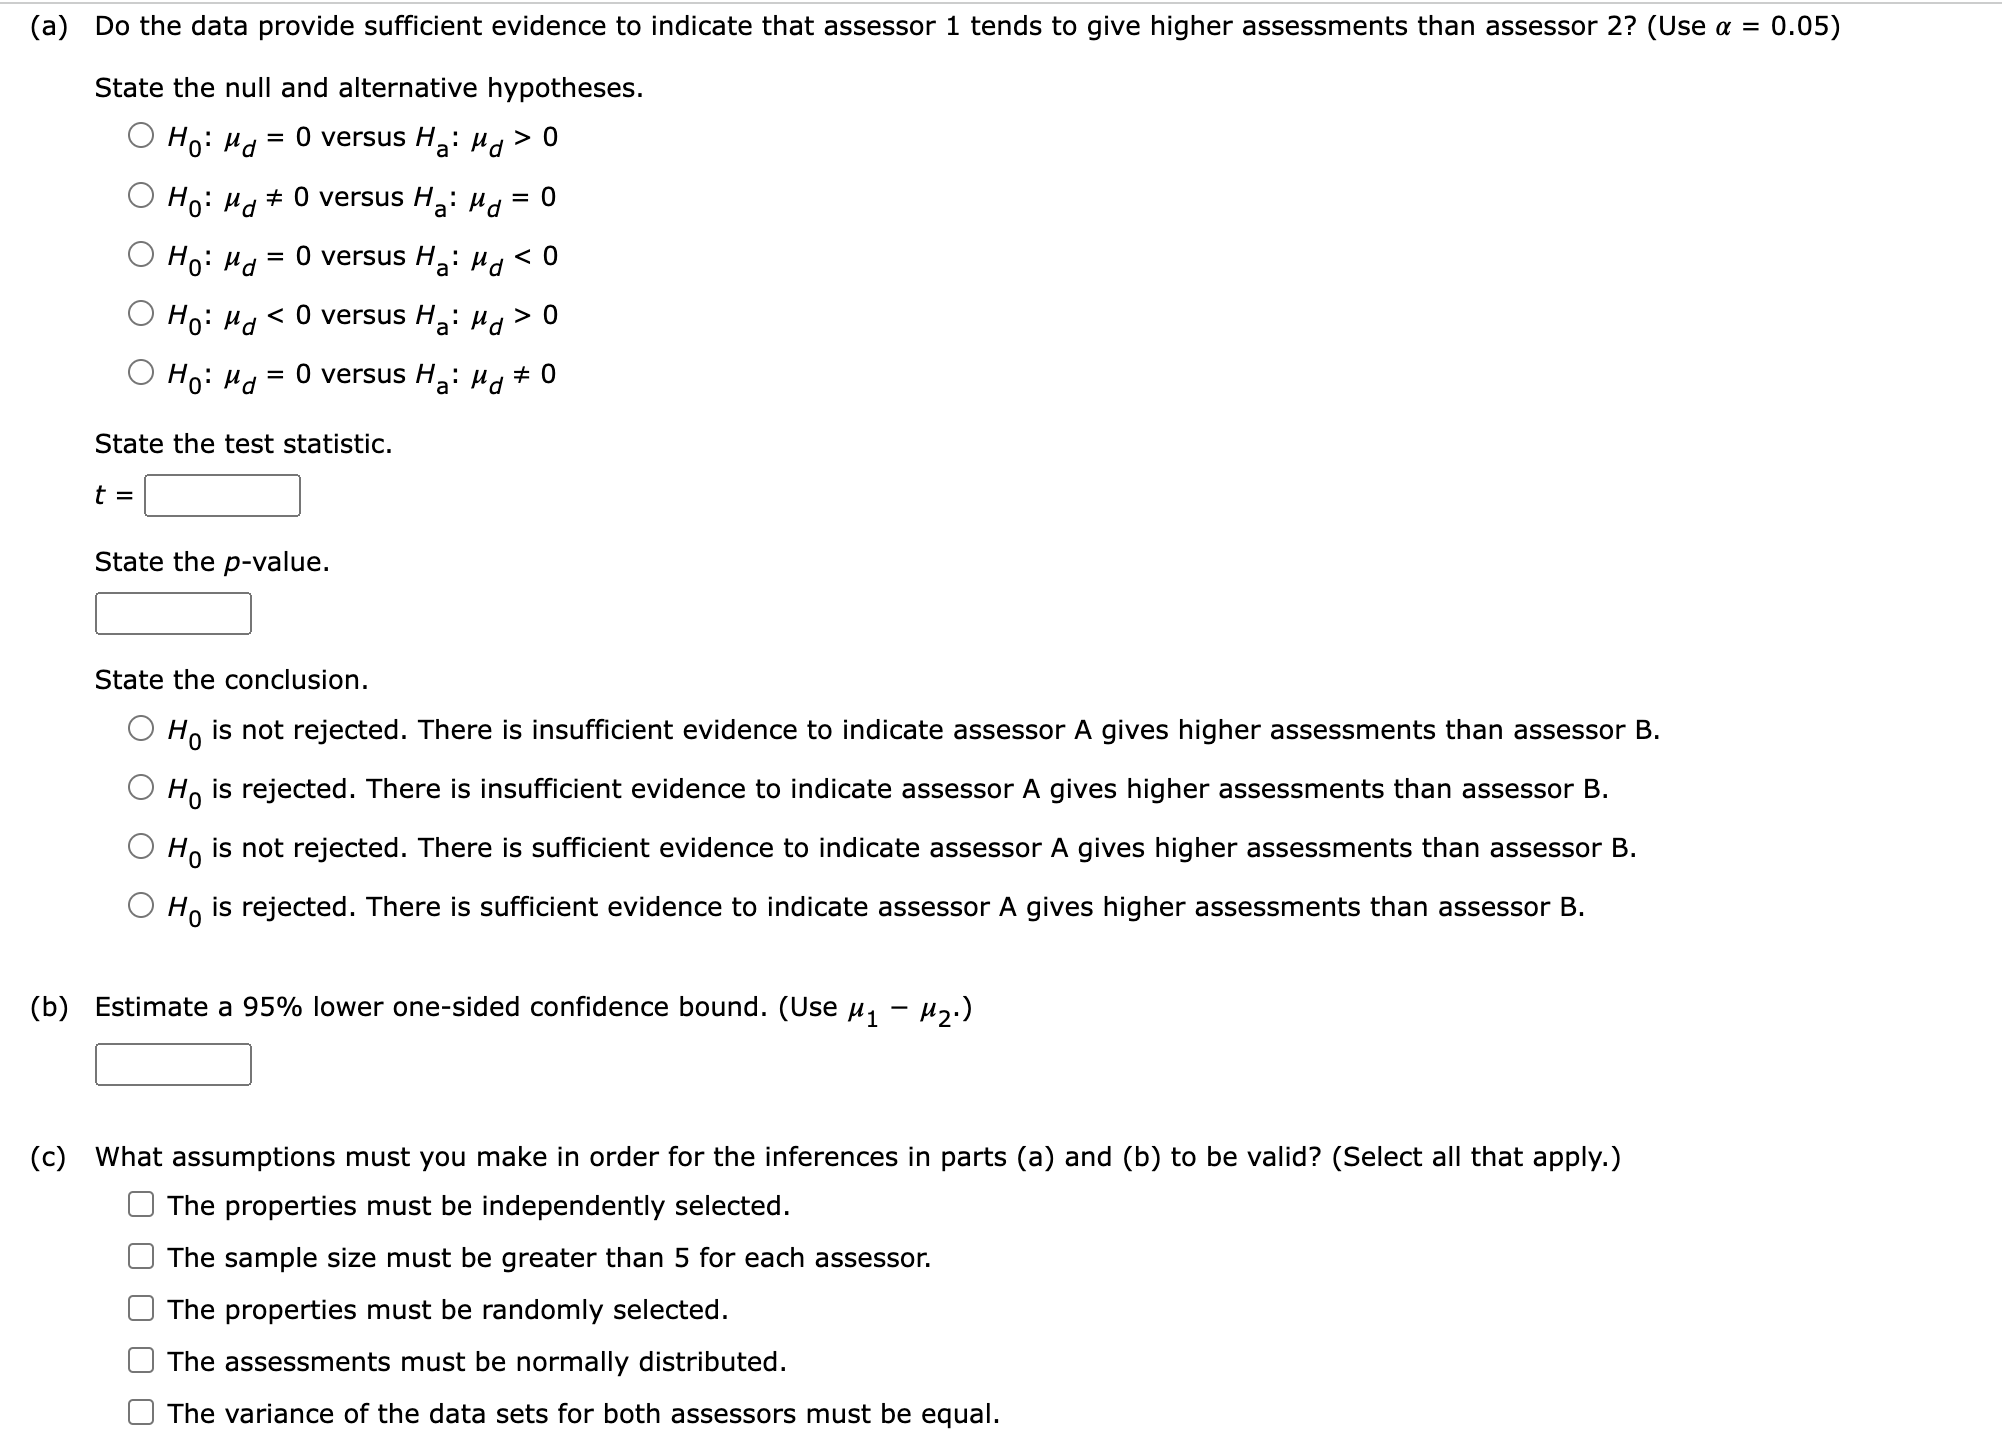
In an experiment to study an oral rinse designed to prevent plaque buildup, subjects were divided into two groupsone group used a rinse with an antiplaque ingredient, and the control group used a rinse containing inactive ingredients. Suppose that the plaque growth on each person's teeth was measured after using the rinse after 4 hours and then again after 8 hours. If you wish to estimate the difference in plaque growth from 4 to 8 hours, should you use a confidence interval based on a paired or an unpaired analysis? Explain. If two measurements are taken on the same person, then the measurements independent, thus you should use ~/ ---Se|ect--- 1a|ysis. a paired Miami lep') had" an unpaired 17. [-/6 Points] DETAILS MENDSTAT15 10.4.019. 0/6 Submissions Used MY NOTES ASK YOUR TEACHER In response to a complaint that a particular tax assessor (1) was biased, an experiment was conducted to compare the assessor named in the complaint with another tax assessor (2) from the same office. Eight properties were selected, and each was assessed by both assessors. The assessments (in thousands of dollars) are shown in the table. Property Assessor 1 Assessor 2 1 276.9 274.3 2 288.7 287.6 3 280.9 278.2 4 295.1 291.0 5 268.8 268.4 6 282.9 280.3 7 276.2 274.9 8 279.1 279.9 Use the MINITAB printout to answer the questions that follow. (Use the exact values found in the MINITAB output. ) Paired T-Test and CI: Assessor 1, Assessor 2 Descriptive Statistics Sample N Mean StDev SE Mean Assessor 1 281. 08 8 . 05 2. 85 Assessor 2 279.33 7.29 2 . 58 Estimation for Paired Difference 95% Lower Bound Mean StDev SE Mean for u difference 1 . 750 1 . 550 0 . 548 0 . 712 u difference: mean of (Assessor 1 - Assessor 2) Test Null hypothesis H: M_difference = Alternative hypothesis H : M_difference > 0 T-Value P-Value 3. 19 0 . 008(a) Do the data provide sufficient evidence to indicate that assessor 1 tends to give higher assessments than assessor 2? (Use a = 0.05) State the null and alternative hypotheses. O HO: \"d = 0 versus Ha: \"d > 0 O H0: \"at i 0 versus Ha: ,ud = O HO: yd = 0 versus Ha: yd 0 O H0: \"0' = 0 versus Ha: \"d 0 State the test statistic. State the p-value. :1 State the conclusion. O H0 is not rejected. There is insufficient evidence to indicate assessor A gives higher assessments than assessor B. O H0 is rejected. There is insufficient evidence to indicate assessor A gives higher assessments than assessor B. O H0 is not rejected. There is sufficient evidence to indicate assessor A gives higher assessments than assessor B. O H0 is rejected. There is sufficient evidence to indicate assessor A gives higher assessments than assessor B. (b) Estimate a 95% lower one-sided confidence bound. (Use \"1 #2.) (c) What assumptions must you make in order for the inferences in parts (a) and (b) to be valid? (Select all that apply.) C] The properties must be independently selected. C] The sample size must be greater than 5 for each assessor. C] The properties must be randomly selected. C] The assessments must be normally distributed. C] The variance of the data sets for both assessors must be equal. 18. [-I5 Points] DETAILS MENDSTAT15 10.4.0235. 0/6 Submissions Used MY NOTES ASK YOUR TEACHER Data were collected on lost-time accidents (mean work-hours lost per month over a period of 1 year) before and after an industrial safety program was put into effect at six industrial plants. Plant Number 1 2 3 4 5 6 Before Program 39 64 40 70 59 31 After Program 29 56 44 64 52 30 m USE SALT Do the data provide sufficient evidence to indicate whether the safety program was effective in reducing lost-time accidents? Test using a = 0.01. (Use \"before \"after = yd.) State the null and alternative hypotheses. O HO: yd t 0 versus Ha: \"d = 0 O HO: \"d = 0 versus Ha: \"d > 0 O HO: \"d = 0 versus Ha: \"d * 0 O HO: yd 0 O HO: yd = 0 versus Ha: \"d t 0 O H0: \":1 $ 0 versus Ha: yd = O Ho: yd = 0 versus Ha: yd 0 O Ho: \"d = 0 versus Ha: \"d > 0 State the test statistic. (Round your answer to three decimal places.) t = :1 State the rejection region. (If the test is one-tailed, enter NONE for the unused region. Round your answers to three decimal places.) . > E :l t
Step by Step Solution
There are 3 Steps involved in it
Step: 1
Get Instant Access to Expert-Tailored Solutions
See step-by-step solutions with expert insights and AI powered tools for academic success
Step: 2
Step: 3
Ace Your Homework with AI
Get the answers you need in no time with our AI-driven, step-by-step assistance