

Question
In an unrelated analysis, you have the opportunity to choose between the following two mutually exclusive projects, Project T (which lasts for 2 years) and
- In an unrelated analysis, you have the opportunity to choose between the following two mutually exclusive projects, Project T (which lasts for 2 years) and Project F (which lasts for 4 years):
Net cash flows in thousands of dollars
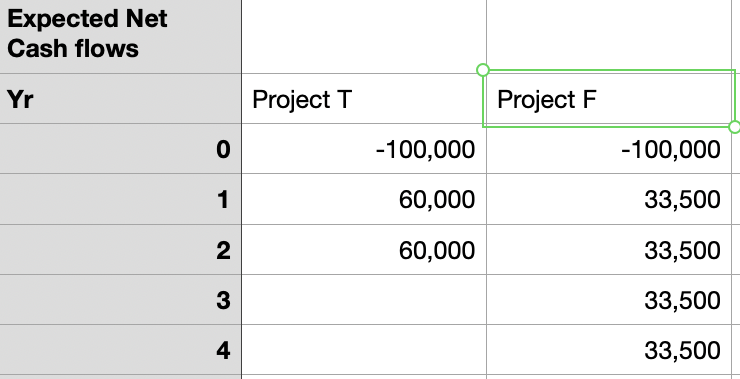
The projects provide a necessary service, so whichever one is selected is expected to be repeated into the foreseeable future. Both projects have a 10% cost of capital.
(1) What is each projects initial NPV without replication?
(2) What is each projects equivalent annual annuity?
(3) Apply the replacement chain approach to determine the projects extended NPVs. Which project should be chosen?
(4) Assume that the cost to replicate Project T in 2 years will increase to $105,000 due to inflation. How should the analysis be handled now, and which project should be chosen?
2. You are also considering another project that has a physical life of 3 yearsthat is, the machinery will be totally worn out after 3 years. However, if the project were terminated prior to the end of 3 years, the machinery would have a positive salvage value. Here are the projects estimated cash flows:
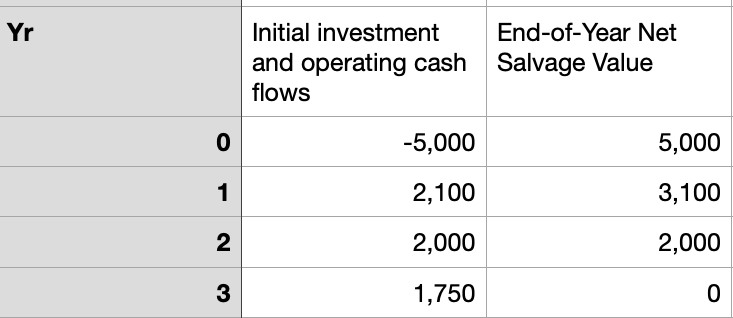
Using the 10% cost of capital, what is the projects NPV if it is operated for the full 3 years? Would the NPV change if the company planned to terminate the project at the end of Year 2? At the end of Year 1? What is the projects optimal (economic) life?
\begin{tabular}{|r|r|r|} \begin{tabular}{l} Expected Net \\ Cash flows \end{tabular} & & \\ \\ Yr & Project T & \multicolumn{2}{|l|}{ Project F } \\ \hline 0 & 100,000 & 100,000 \\ \hline 1 & 60,000 & 33,500 \\ \hline 3 & 60,000 & 33,500 \\ \hline 4 & & 33,500 \\ \hline \end{tabular} \begin{tabular}{r|r|r|} \hline Yr & \begin{tabular}{l} Initial investment \\ and operating cash \\ flows \end{tabular} & \begin{tabular}{l} End-of-Year Net \\ Salvage Value \end{tabular} \\ \hline 0 & 5,000 & 5,000 \\ \hline 1 & 2,100 & 3,100 \\ \hline 2 & 2,000 & 2,000 \\ \hline 3 & 1,750 & 0 \end{tabular} \begin{tabular}{|r|r|r|} \begin{tabular}{l} Expected Net \\ Cash flows \end{tabular} & & \\ \\ Yr & Project T & \multicolumn{2}{|l|}{ Project F } \\ \hline 0 & 100,000 & 100,000 \\ \hline 1 & 60,000 & 33,500 \\ \hline 3 & 60,000 & 33,500 \\ \hline 4 & & 33,500 \\ \hline \end{tabular} \begin{tabular}{r|r|r|} \hline Yr & \begin{tabular}{l} Initial investment \\ and operating cash \\ flows \end{tabular} & \begin{tabular}{l} End-of-Year Net \\ Salvage Value \end{tabular} \\ \hline 0 & 5,000 & 5,000 \\ \hline 1 & 2,100 & 3,100 \\ \hline 2 & 2,000 & 2,000 \\ \hline 3 & 1,750 & 0 \end{tabular}Step by Step Solution
There are 3 Steps involved in it
Step: 1

Get Instant Access to Expert-Tailored Solutions
See step-by-step solutions with expert insights and AI powered tools for academic success
Step: 2

Step: 3
Ace Your Homework with AI
Get the answers you need in no time with our AI-driven, step-by-step assistance
Get Started
The Business Credit Handbook
Authors: Mr. Reid A. Nunn
1st Edition
1500542725, 978-1500542726