Answered step by step
Verified Expert Solution
Link Copied!

Question

1 Approved Answer

In cells G4:14, create cell references for the values that correspond to the headings in G3:13. Format the range G4:14 to hide the values you
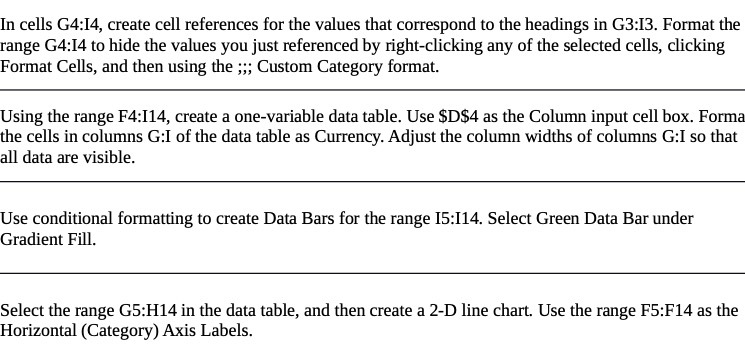
image text in transcribed
In cells G4:14, create cell references for the values that correspond to the headings in G3:13. Format the range G4:14 to hide the values you just referenced by right-clicking any of the selected cells, clicking Format Cells, and then using the ;;; Custom Category format. Using the range F4:I14, create a one-variable data table. Use $D$4 as the Column input cell box. Forma the cells in columns G:I of the data table as Currency. Adjust the column widths of columns G:I so that all data are visible. Use conditional formatting to create Data Bars for the range 15:I14. Select Green Data Bar under Gradient Fill. Select the range G5:H14 in the data table, and then create a 2-D line chart. Use the range F5:F14 as the Horizontal (Category) Axis Labels

Step by Step Solution

There are 3 Steps involved in it

Step: 1

blur-text-image

Get Instant Access to Expert-Tailored Solutions

See step-by-step solutions with expert insights and AI powered tools for academic success

Step: 2

blur-text-image

Step: 3

blur-text-image

Ace Your Homework with AI

Get the answers you need in no time with our AI-driven, step-by-step assistance

Get Started

Recommended Textbook for

Quantitative Methods For Business

Authors: David Anderson, Dennis Sweeney, Thomas Williams, Jeffrey Cam

12th Edition

840062338, 840062346, 9780840062338, 978-0840062345

More Books

Students also viewed these General Management questions