Question
In communicating technical information, one needs to use illustrations either in addition to words or instead of words to convey the message. See the

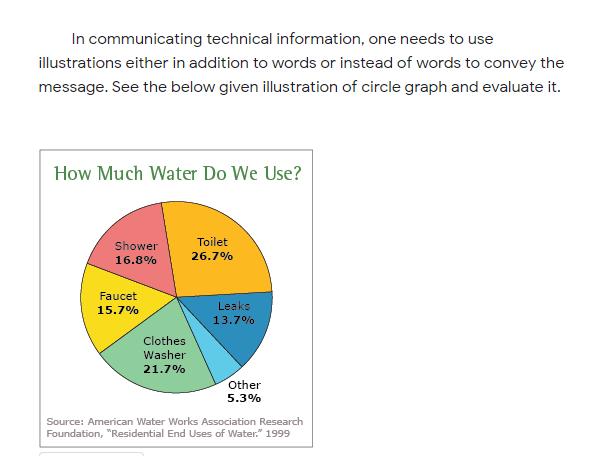
In communicating technical information, one needs to use illustrations either in addition to words or instead of words to convey the message. See the below given illustration of circle graph and evaluate it. How Much Water Do We Use? Shower 16.8% Faucet 15.7% Clothes Washer 21.7% Toilet 26.7% Leaks 13.7% Other 5.3% Source: American Water Works Association Research Foundation, "Residential End Uses of Water." 1999
Step by Step Solution
3.32 Rating (146 Votes )
There are 3 Steps involved in it
Step: 1
Answer We can define the data given in the pie chart as below For simplification and to understand b...
Get Instant Access to Expert-Tailored Solutions
See step-by-step solutions with expert insights and AI powered tools for academic success
Step: 2

Step: 3

Ace Your Homework with AI
Get the answers you need in no time with our AI-driven, step-by-step assistance
Get StartedRecommended Textbook for
Microeconomics An Intuitive Approach with Calculus
Authors: Thomas Nechyba
1st edition
538453257, 978-0538453257
Students also viewed these Accounting questions
Question
Answered: 1 week ago
Question
Answered: 1 week ago
Question
Answered: 1 week ago
Question
Answered: 1 week ago
Question
Answered: 1 week ago
Question
Answered: 1 week ago
Question
Answered: 1 week ago
Question
Answered: 1 week ago
Question
Answered: 1 week ago
Question
Answered: 1 week ago
Question
Answered: 1 week ago
Question
Answered: 1 week ago
Question
Answered: 1 week ago
Question
Answered: 1 week ago
Question
Answered: 1 week ago
Question
Answered: 1 week ago
Question
Answered: 1 week ago
Question
Answered: 1 week ago
Question
Answered: 1 week ago
Question
Answered: 1 week ago
Question
Answered: 1 week ago
Question
Answered: 1 week ago
Question
Answered: 1 week ago
View Answer in SolutionInn App


