

Answered step by step
Verified Expert Solution
Question
1 Approved Answer
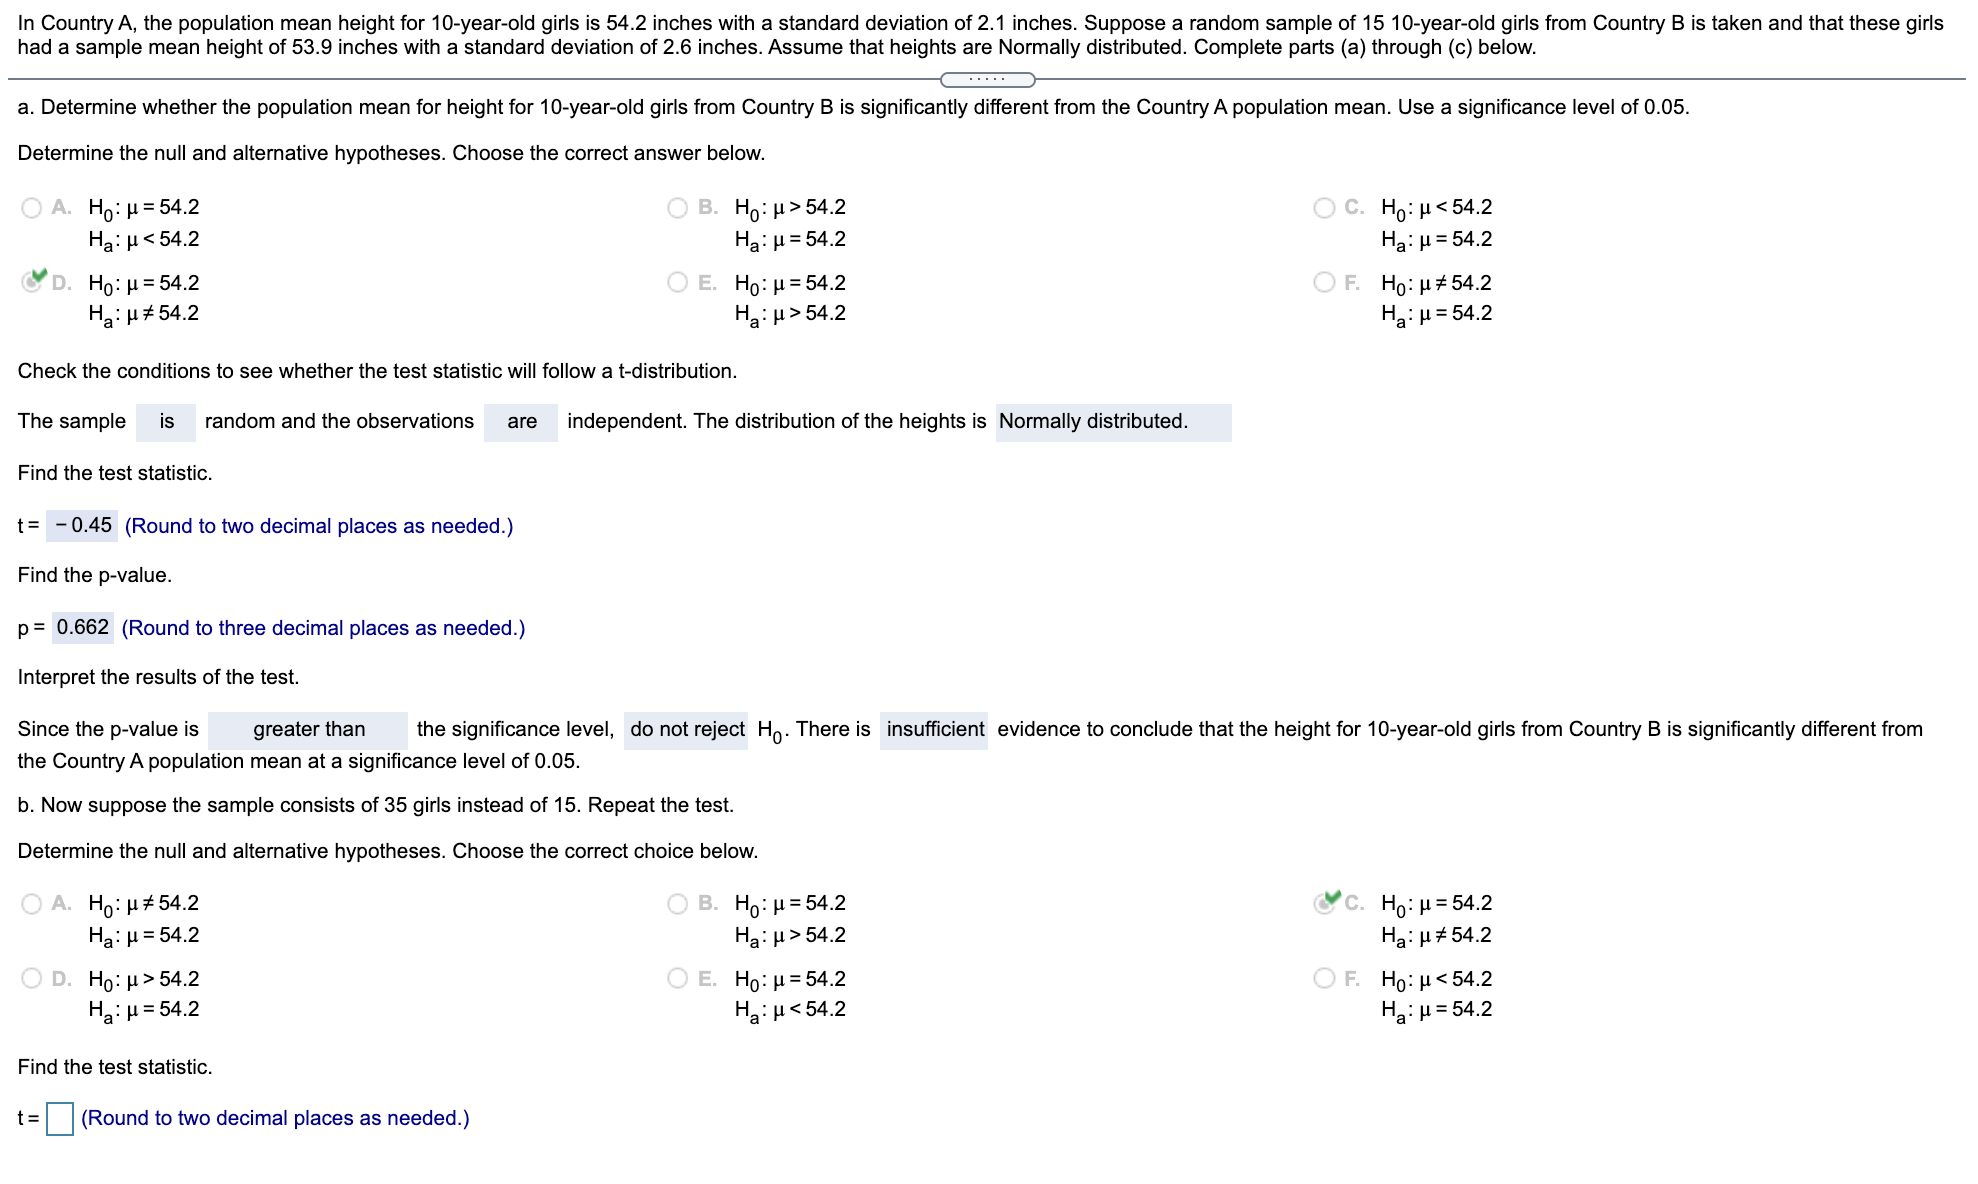
In Country A, the population mean height for 10-year-old girls is 54.2 inches with a standard deviation of 2.1 inches. Suppose a random sample of
Step by Step Solution
There are 3 Steps involved in it
Step: 1

Get Instant Access to Expert-Tailored Solutions
See step-by-step solutions with expert insights and AI powered tools for academic success
Step: 2

Step: 3
Ace Your Homework with AI
Get the answers you need in no time with our AI-driven, step-by-step assistance
Get Started
Introductory Statistics Exploring The World Through Data
Authors: Robert Gould, Rebecca Wong, Colleen N. Ryan
3rd Edition
0135163145, 978-0135163146