

Answered step by step
Verified Expert Solution
Question
1 Approved Answer
in excel please 3. Baseball Franchise Values The value of a sports franchise is directly related to the amount of revenue that a franchise can
in excel please 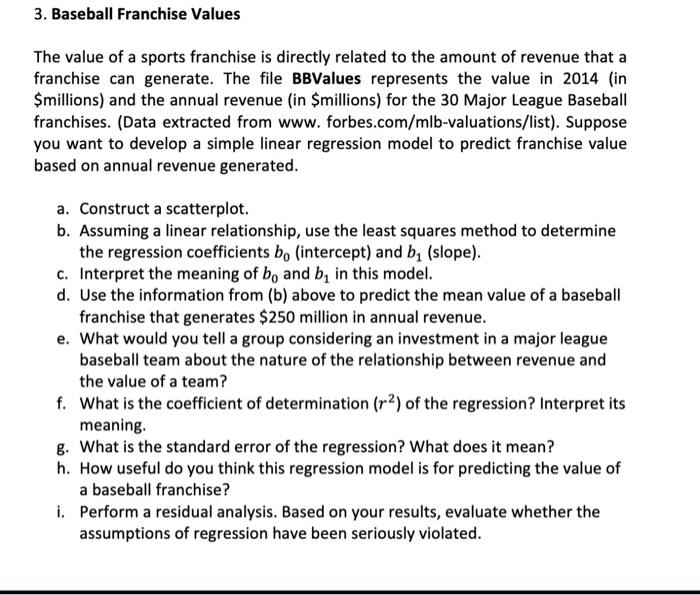
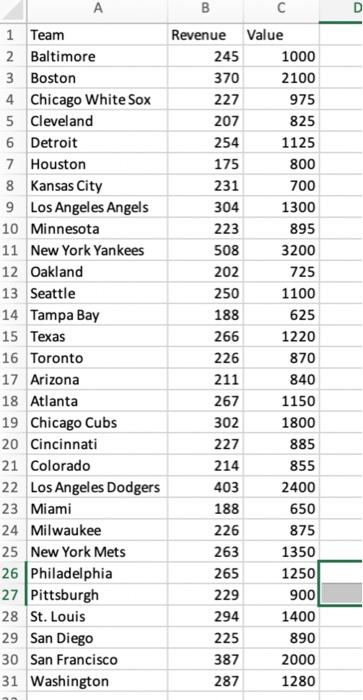
3. Baseball Franchise Values The value of a sports franchise is directly related to the amount of revenue that a franchise can generate. The file BBValues represents the value in 2014 (in $millions) and the annual revenue (in millions) for the 30 Major League Baseball franchises. (Data extracted from www. forbes.com/mlb-valuations/list). Suppose you want to develop a simple linear regression model to predict franchise value based on annual revenue generated. a. Construct a scatterplot. b. Assuming a linear relationship, use the least squares method to determine the regression coefficients bo (intercept) and b(slope). c. Interpret the meaning of bo and b, in this model. d. Use the information from (b) above to predict the mean value of a baseball franchise that generates $250 million in annual revenue. e. What would you tell a group considering an investment in a major league baseball team about the nature of the relationship between revenue and the value of a team? f. What is the coefficient of determination (r2) of the regression? Interpret its meaning. g. What is the standard error of the regression? What does it mean? h. How useful do you think this regression model is for predicting the value of a baseball franchise? i. Perform a residual analysis. Based on your results, evaluate whether the assumptions of regression have been seriously violated. B D A 1 Team 2 Baltimore 3 Boston 4 Chicago White Sox 5 Cleveland 6 Detroit 7 Houston 8 Kansas City 9 Los Angeles Angels 10 Minnesota 11 New York Yankees 12 Oakland 13 Seattle 14 Tampa Bay 15 Texas 16 Toronto 17 Arizona 18 Atlanta 19 Chicago Cubs 20 Cincinnati 21 Colorado 22 Los Angeles Dodgers 23 Miami 24 Milwaukee 25 New York Mets 26 Philadelphia 27 Pittsburgh 28 St. Louis 29 San Diego 30 San Francisco 31 Washington B Revenue Value 245 1000 370 2100 227 975 207 825 254 1125 175 800 231 700 304 1300 223 895 508 3200 202 725 250 1100 188 625 266 1220 226 870 211 840 267 1150 302 1800 227 885 214 855 403 2400 188 650 226 875 263 1350 265 1250 229 900 294 1400 225 890 387 2000 287 1280 3. Baseball Franchise Values The value of a sports franchise is directly related to the amount of revenue that a franchise can generate. The file BBValues represents the value in 2014 (in $millions) and the annual revenue (in millions) for the 30 Major League Baseball franchises. (Data extracted from www. forbes.com/mlb-valuations/list). Suppose you want to develop a simple linear regression model to predict franchise value based on annual revenue generated. a. Construct a scatterplot. b. Assuming a linear relationship, use the least squares method to determine the regression coefficients bo (intercept) and b(slope). c. Interpret the meaning of bo and b, in this model. d. Use the information from (b) above to predict the mean value of a baseball franchise that generates $250 million in annual revenue. e. What would you tell a group considering an investment in a major league baseball team about the nature of the relationship between revenue and the value of a team? f. What is the coefficient of determination (r2) of the regression? Interpret its meaning. g. What is the standard error of the regression? What does it mean? h. How useful do you think this regression model is for predicting the value of a baseball franchise? i. Perform a residual analysis. Based on your results, evaluate whether the assumptions of regression have been seriously violated. B D A 1 Team 2 Baltimore 3 Boston 4 Chicago White Sox 5 Cleveland 6 Detroit 7 Houston 8 Kansas City 9 Los Angeles Angels 10 Minnesota 11 New York Yankees 12 Oakland 13 Seattle 14 Tampa Bay 15 Texas 16 Toronto 17 Arizona 18 Atlanta 19 Chicago Cubs 20 Cincinnati 21 Colorado 22 Los Angeles Dodgers 23 Miami 24 Milwaukee 25 New York Mets 26 Philadelphia 27 Pittsburgh 28 St. Louis 29 San Diego 30 San Francisco 31 Washington B Revenue Value 245 1000 370 2100 227 975 207 825 254 1125 175 800 231 700 304 1300 223 895 508 3200 202 725 250 1100 188 625 266 1220 226 870 211 840 267 1150 302 1800 227 885 214 855 403 2400 188 650 226 875 263 1350 265 1250 229 900 294 1400 225 890 387 2000 287 1280 Step by Step Solution
There are 3 Steps involved in it
Step: 1

Get Instant Access to Expert-Tailored Solutions
See step-by-step solutions with expert insights and AI powered tools for academic success
Step: 2

Step: 3
Ace Your Homework with AI
Get the answers you need in no time with our AI-driven, step-by-step assistance
Get Started
Venture Capital Islamic Finance And SMEs Valuation Structuring And Monitoring Practices In India
Authors: M. Durrani, G. Boocock
1st Edition
1403936382,0230626254