

Answered step by step
Verified Expert Solution
Question
1 Approved Answer
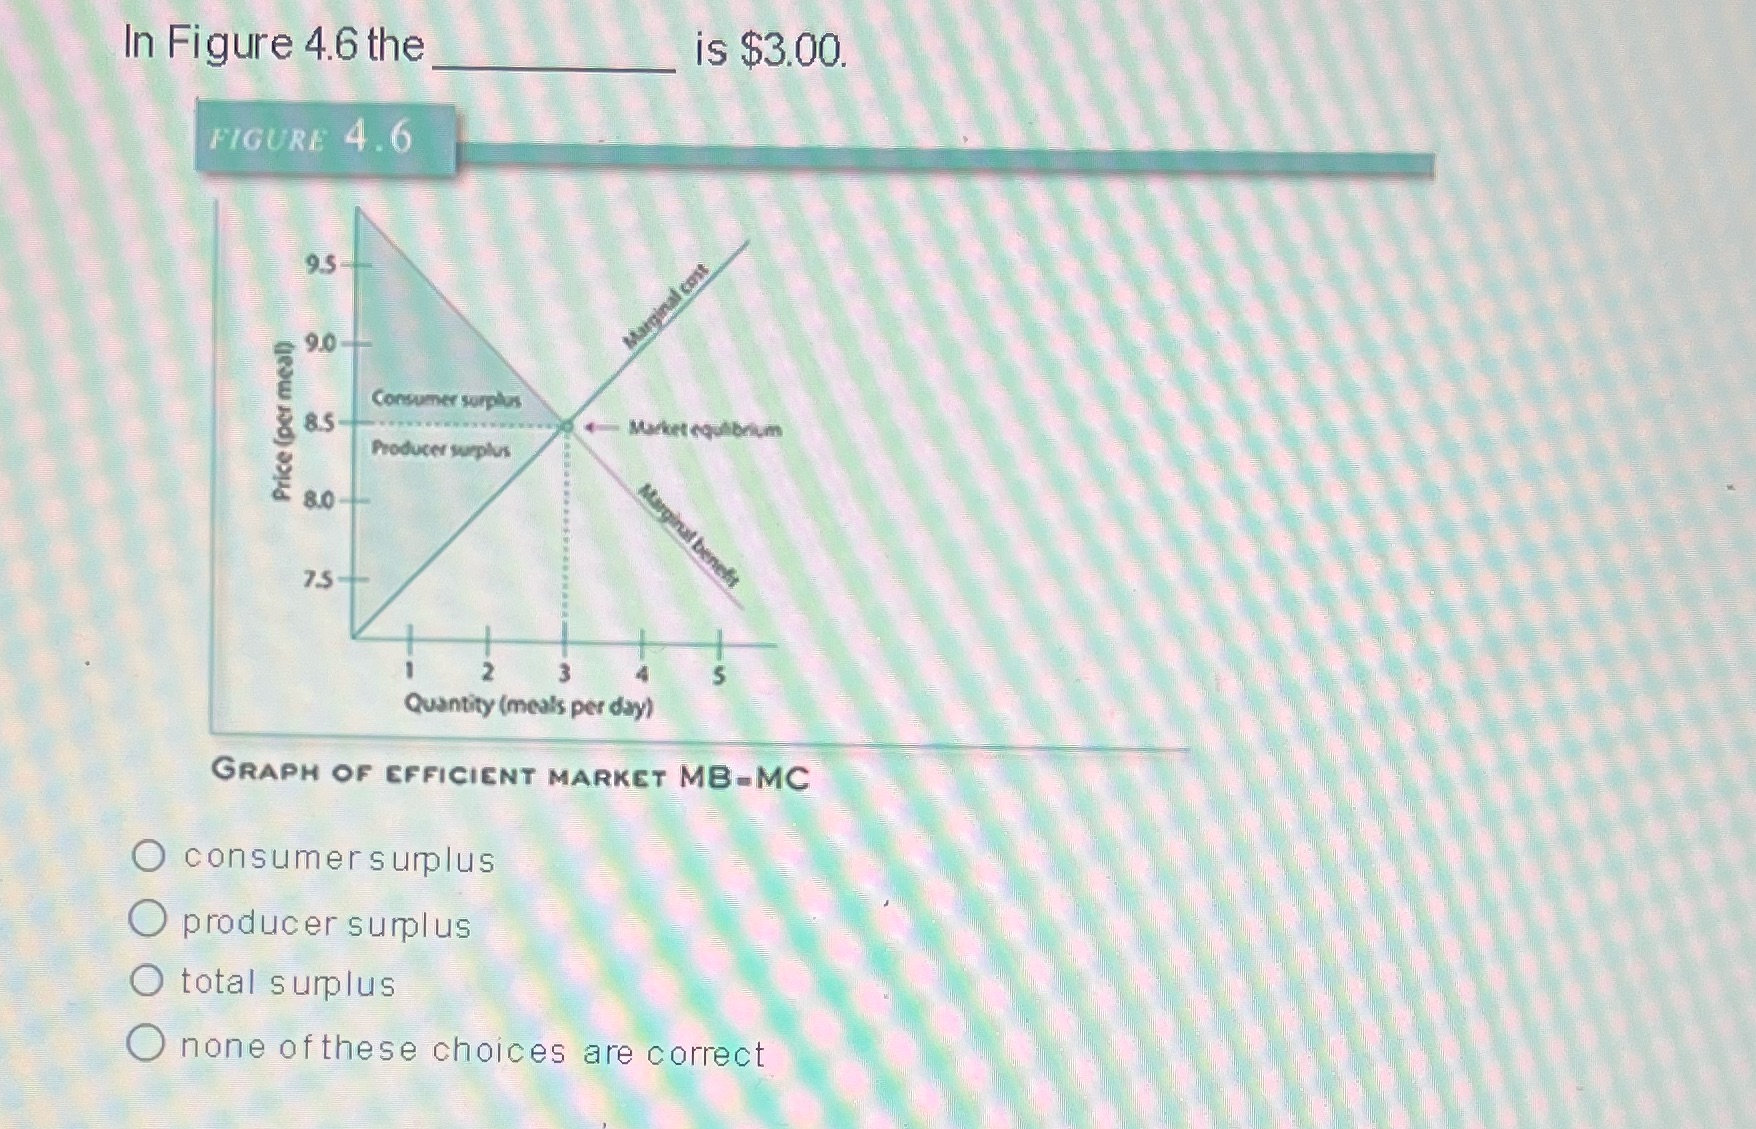
In Figure 4.6 the is $3.00. FIGURE 4.6 95 al cost 9.0 Consumer surplus Price (per meal) 8.5 Producer surplus 8.0- 75- Quantity (meals per

Step by Step Solution
There are 3 Steps involved in it
Step: 1

Get Instant Access to Expert-Tailored Solutions
See step-by-step solutions with expert insights and AI powered tools for academic success
Step: 2

Step: 3
Ace Your Homework with AI
Get the answers you need in no time with our AI-driven, step-by-step assistance
Get Started
Foundations of Macroeconomics
Authors: Robin Bade, Michael Parkin
6th edition
132831007, 978-0132831000