Answered step by step
Verified Expert Solution
Question
1 Approved Answer
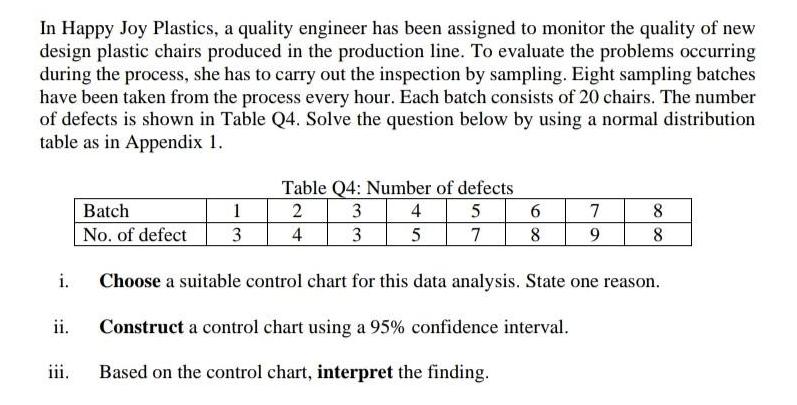
In Happy Joy Plastics, a quality engineer has been assigned to monitor the quality of new design plastic chairs produced in the production line.


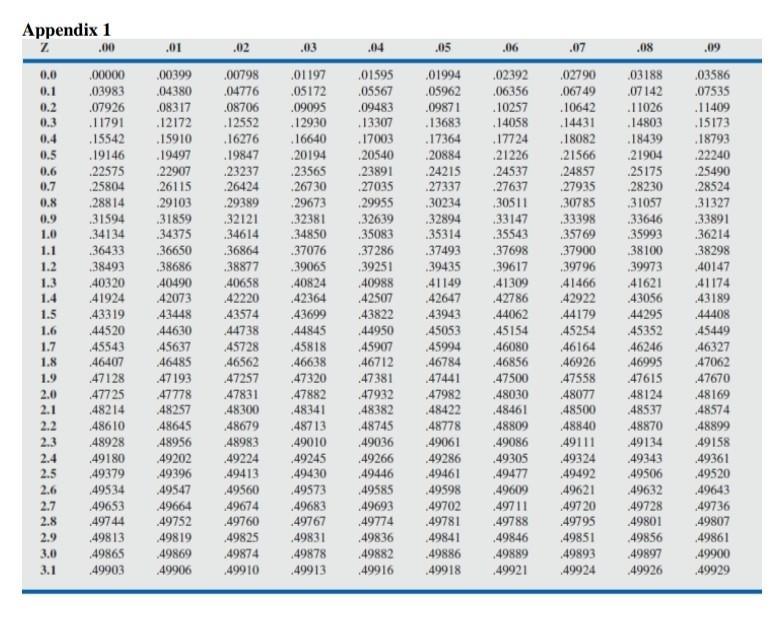
In Happy Joy Plastics, a quality engineer has been assigned to monitor the quality of new design plastic chairs produced in the production line. To evaluate the problems occurring during the process, she has to carry out the inspection by sampling. Eight sampling batches have been taken from the process every hour. Each batch consists of 20 chairs. The number of defects is shown in Table Q4. Solve the question below by using a normal distribution table as in Appendix 1. i. ii. Batch No. of defect 1 3 Table Q4: Number of defects 2 3 5 4 3 7 4 5 6 8 iii. Based on the control chart, interpret the finding. 7 9 8 8 Choose a suitable control chart for this data analysis. State one reason. Construct a control chart using a 95% confidence interval. Appendix 1 Z 0.0 0.1 0.2 0.5 0.6 0.7 0.8 0.9 1.0 1.1 1.2 1.3 1.5 1.6 1.7 1.8 1.9 2.0 2.1 2.2 2.3 2.4 2.5 2.6 2.7 2.8 2.9 3.0 3.1 .00000 .03983 .07926 .11791 15542 47725 48214 48610 48928 49180 49379 49534 .01 .00399 04380 49653 49744 49813 49865 49903 .08317 .12172 15910 .19497 22907 26115 29103 .19146 22575 25804 28814 31594 .31859 34134 .34375 .36433 .36650 38493 .38686 40320 40490 41924 42073 43319 43448 44520 44630 45543 45637 46407 46485 47128 47193 47778 47831 48257 48300 48645 48679 48956 48983 .02 .00798 .04776 .08706 12552 49202 49396 49547 49664 49752 49819 49869 49906 16276 .19847 23237 26424 29389 .03 .04 01197 .01595 .05172 40658 42220 .09095 .12930 16640 .05567 .09483 .13307 20194 .23565 .26730 .29673 32121 32381 34614 34850 .36864 .37076 38877 .39065 40824 42364 43574 .43699 44738 44845 44950 45728 45818 45907 46562 46638 .46712 47257 47320 47381 47882 47932 48341 48382 48713 48745 49010 .49036 49266 49446 49585 49224 49245 49413 49430 49560 49573 49674 49683 49760 49767 49825 49831 49874 49878 49910 49913 .17003 20540 .23891 27035 29955 .32639 .35083 37286 .39251 40988 42507 43822 .49693 .49774 49836 49882 .49916 .05 .06 .01994 02392 .05962 .06356 .09871 .13683 .17364 20884 .24215 27337 10257 .14058 17724 21226 .24537 .27637 .30234 .30511 .32894 .33147 .35314 .35543 .37493 .37698 .39435 .39617 41309 41466 42922 44179 41149 42647 42786 43943 .44062 45053 49598 49702 .49781 49841 49886 49918 .07 02790 .06749 .10642 14431 .18082 21566 24857 27935 .30785 .33398 .35769 49846 49889 49921 .37900 .39796 45154 45994 46080 46784 .46856 47441 .47500 47558 47982 .48030 48077 48422 48461 48500 48778 .48809 48840 49061 .49086 49111 49286 .49305 49324 49461 49477 49492 49609 49621 49711 49720 .49788 .49795 45254 46164 46926 .08 03188 07142 .11026 14803 .18439 21904 25175 28230 31057 .33646 35993 38100 39973 41621 43056 44295 45352 46246 46995 47615 48124 48537 48870 49134 .49343 49506 49632 49728 49801 49851 49856 49893 49897 49924 49926 .09 03586 .07535 .11409 15173 .18793 22240 25490 28524 31327 33891 36214 38298 40147 41174 43189 44408 45449 46327 47062 47670 48169 48574 48899 49158 49361 49520 49643 49736 49807 49861 49900 49929
Step by Step Solution
There are 3 Steps involved in it
Step: 1
First lets choose a suitable control chart and then construct it i For attribute data where we are counting defects nonconformities the appropriate co...
Get Instant Access to Expert-Tailored Solutions
See step-by-step solutions with expert insights and AI powered tools for academic success
Step: 2

Step: 3

Ace Your Homework with AI
Get the answers you need in no time with our AI-driven, step-by-step assistance
Get Started


