

Answered step by step
Verified Expert Solution
Question
1 Approved Answer
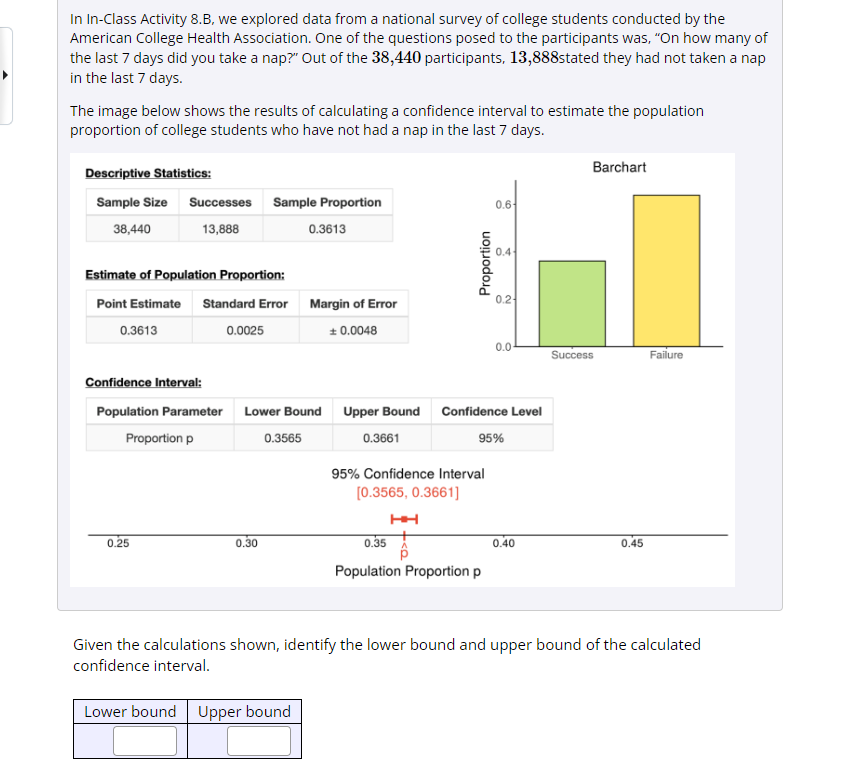
In In-Class Activity 8.B, we explored data from a national survey of college students conducted by the American College Health Association. One of the questions
Step by Step Solution
There are 3 Steps involved in it
Step: 1

Get Instant Access to Expert-Tailored Solutions
See step-by-step solutions with expert insights and AI powered tools for academic success
Step: 2

Step: 3
Ace Your Homework with AI
Get the answers you need in no time with our AI-driven, step-by-step assistance
Get Started
Introduction To Probability Models
Authors: Sheldon M Ross
10th Edition
0123756863, 9780123756862