

Answered step by step
Verified Expert Solution
Question
1 Approved Answer
In its annual report, WRM Athletic Supply, Inc. includes the following five-year financial summary: (Click the icon to view the financial summary.) Read the
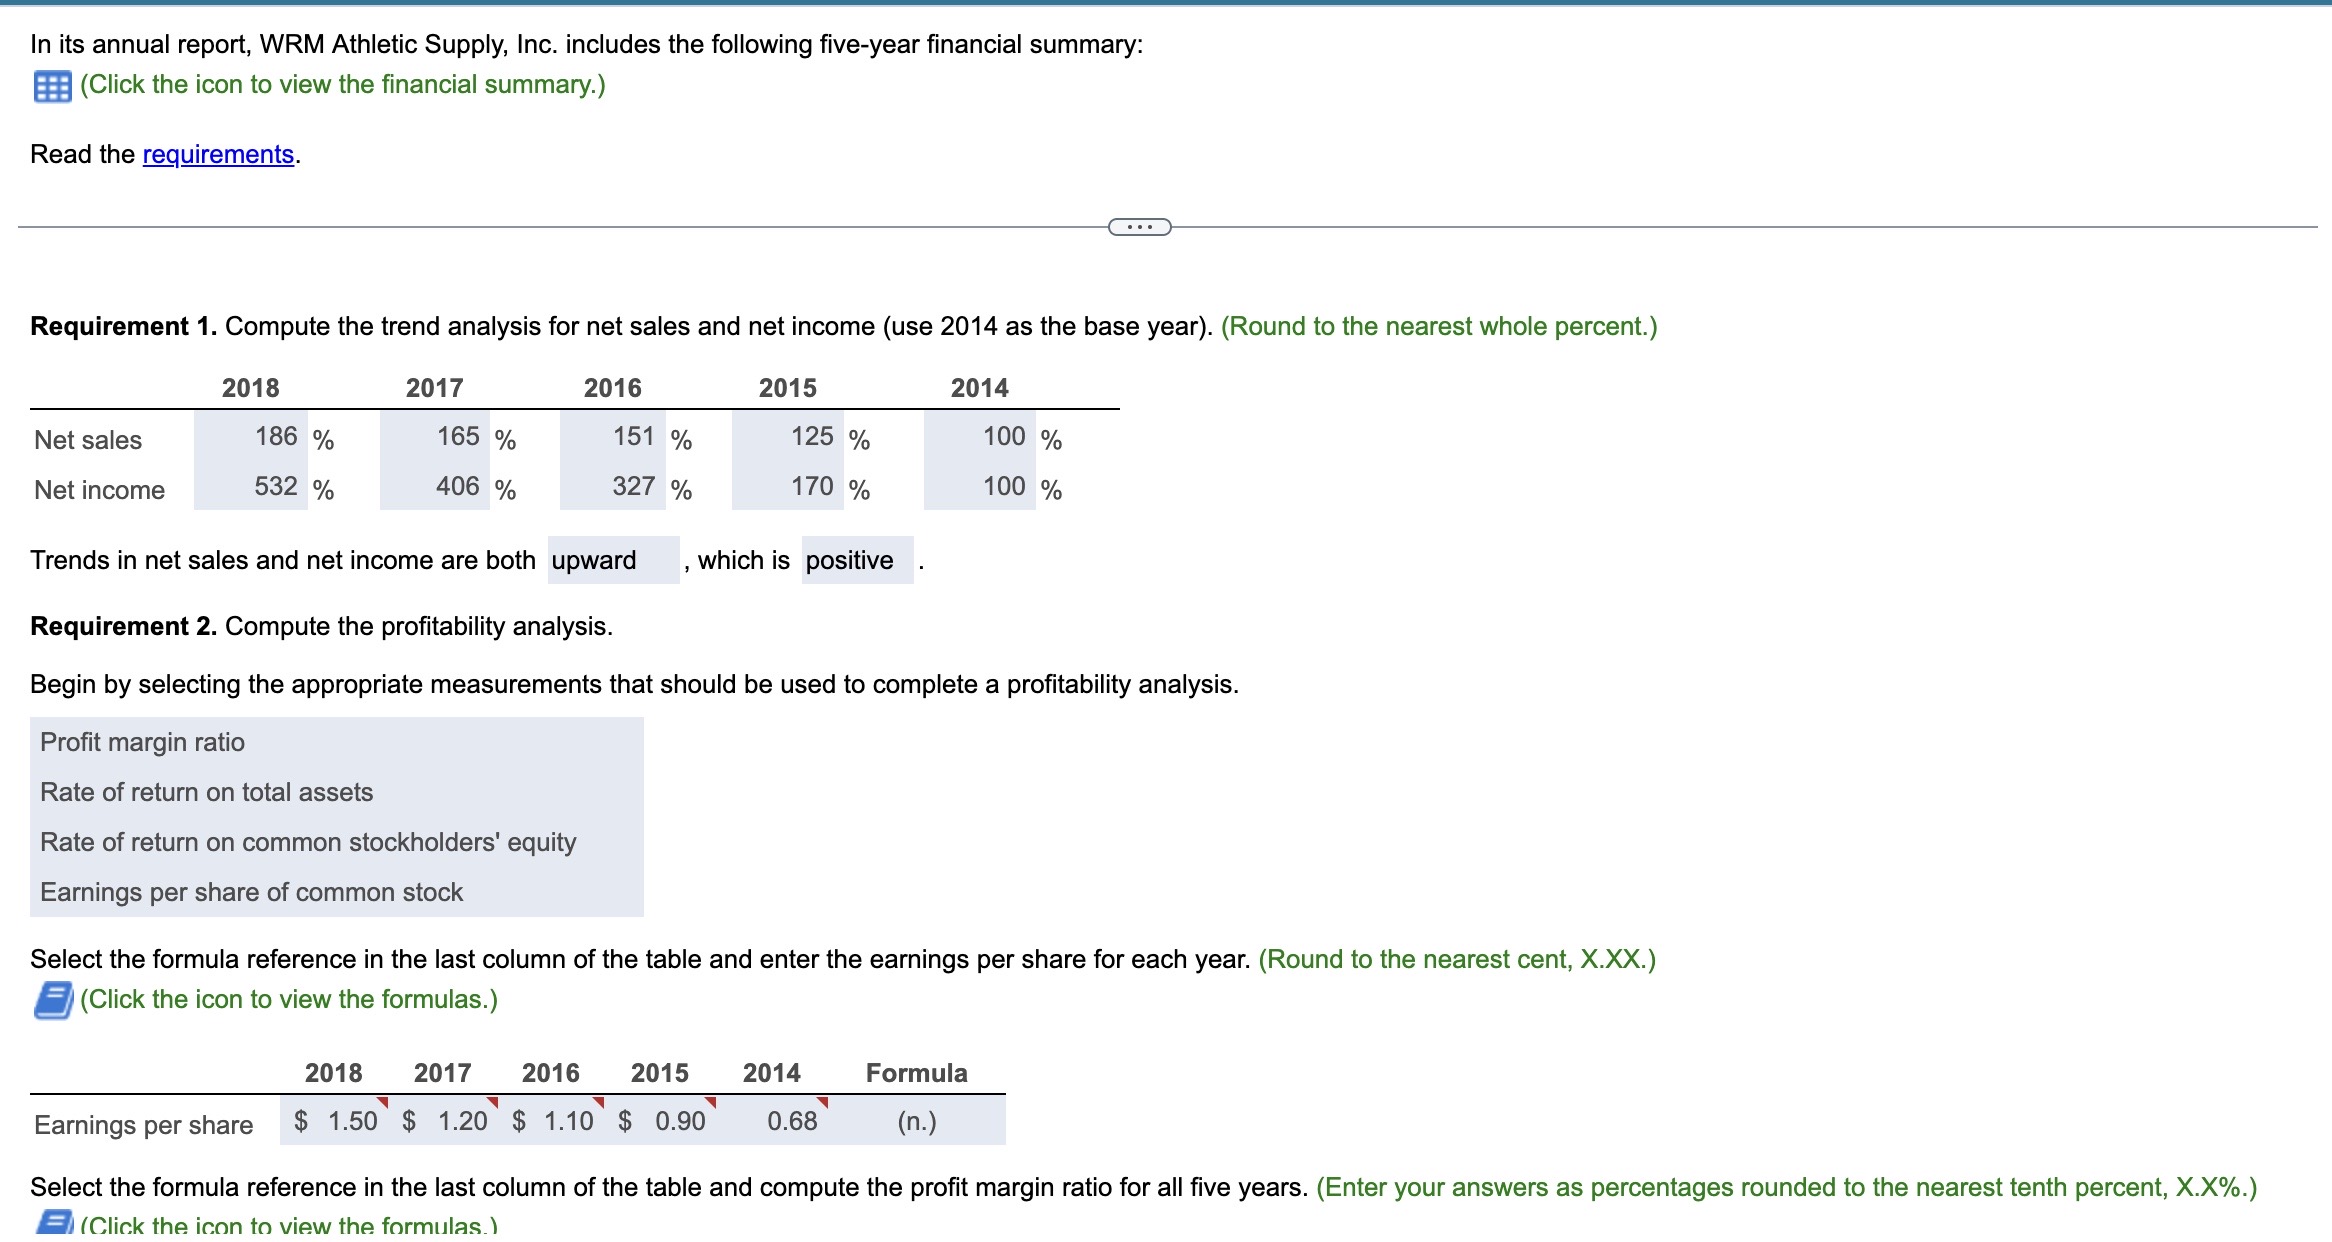
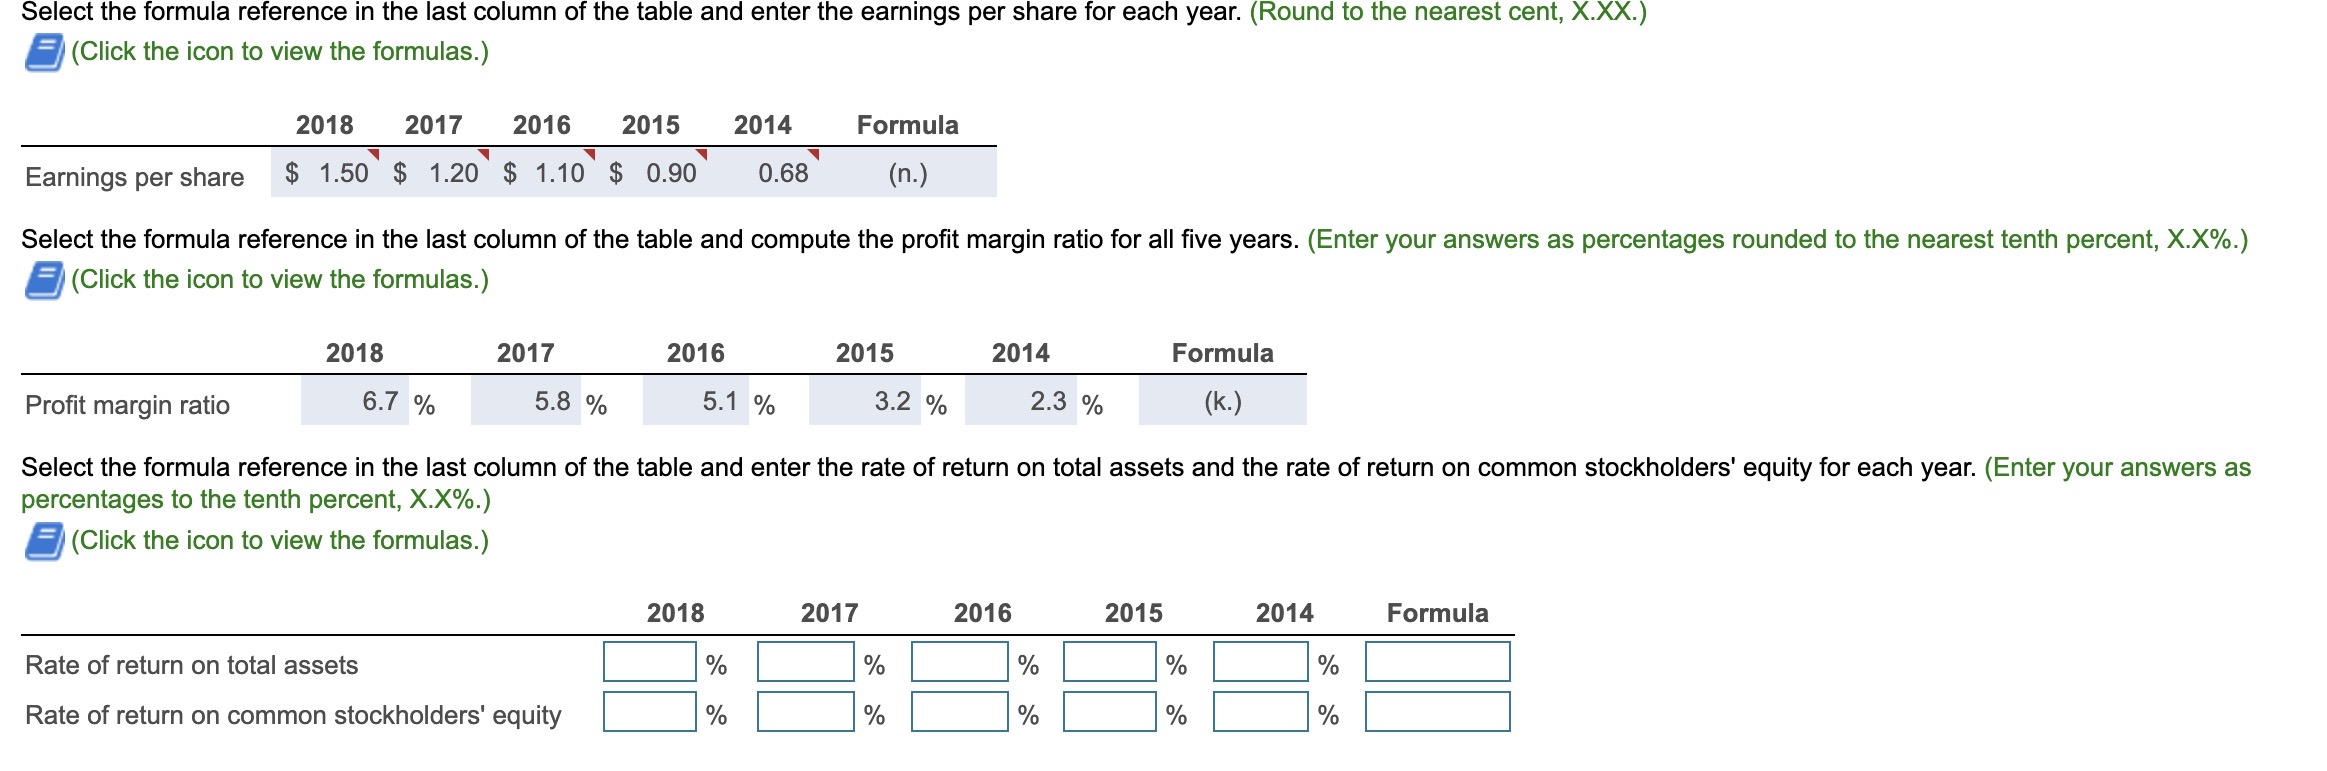
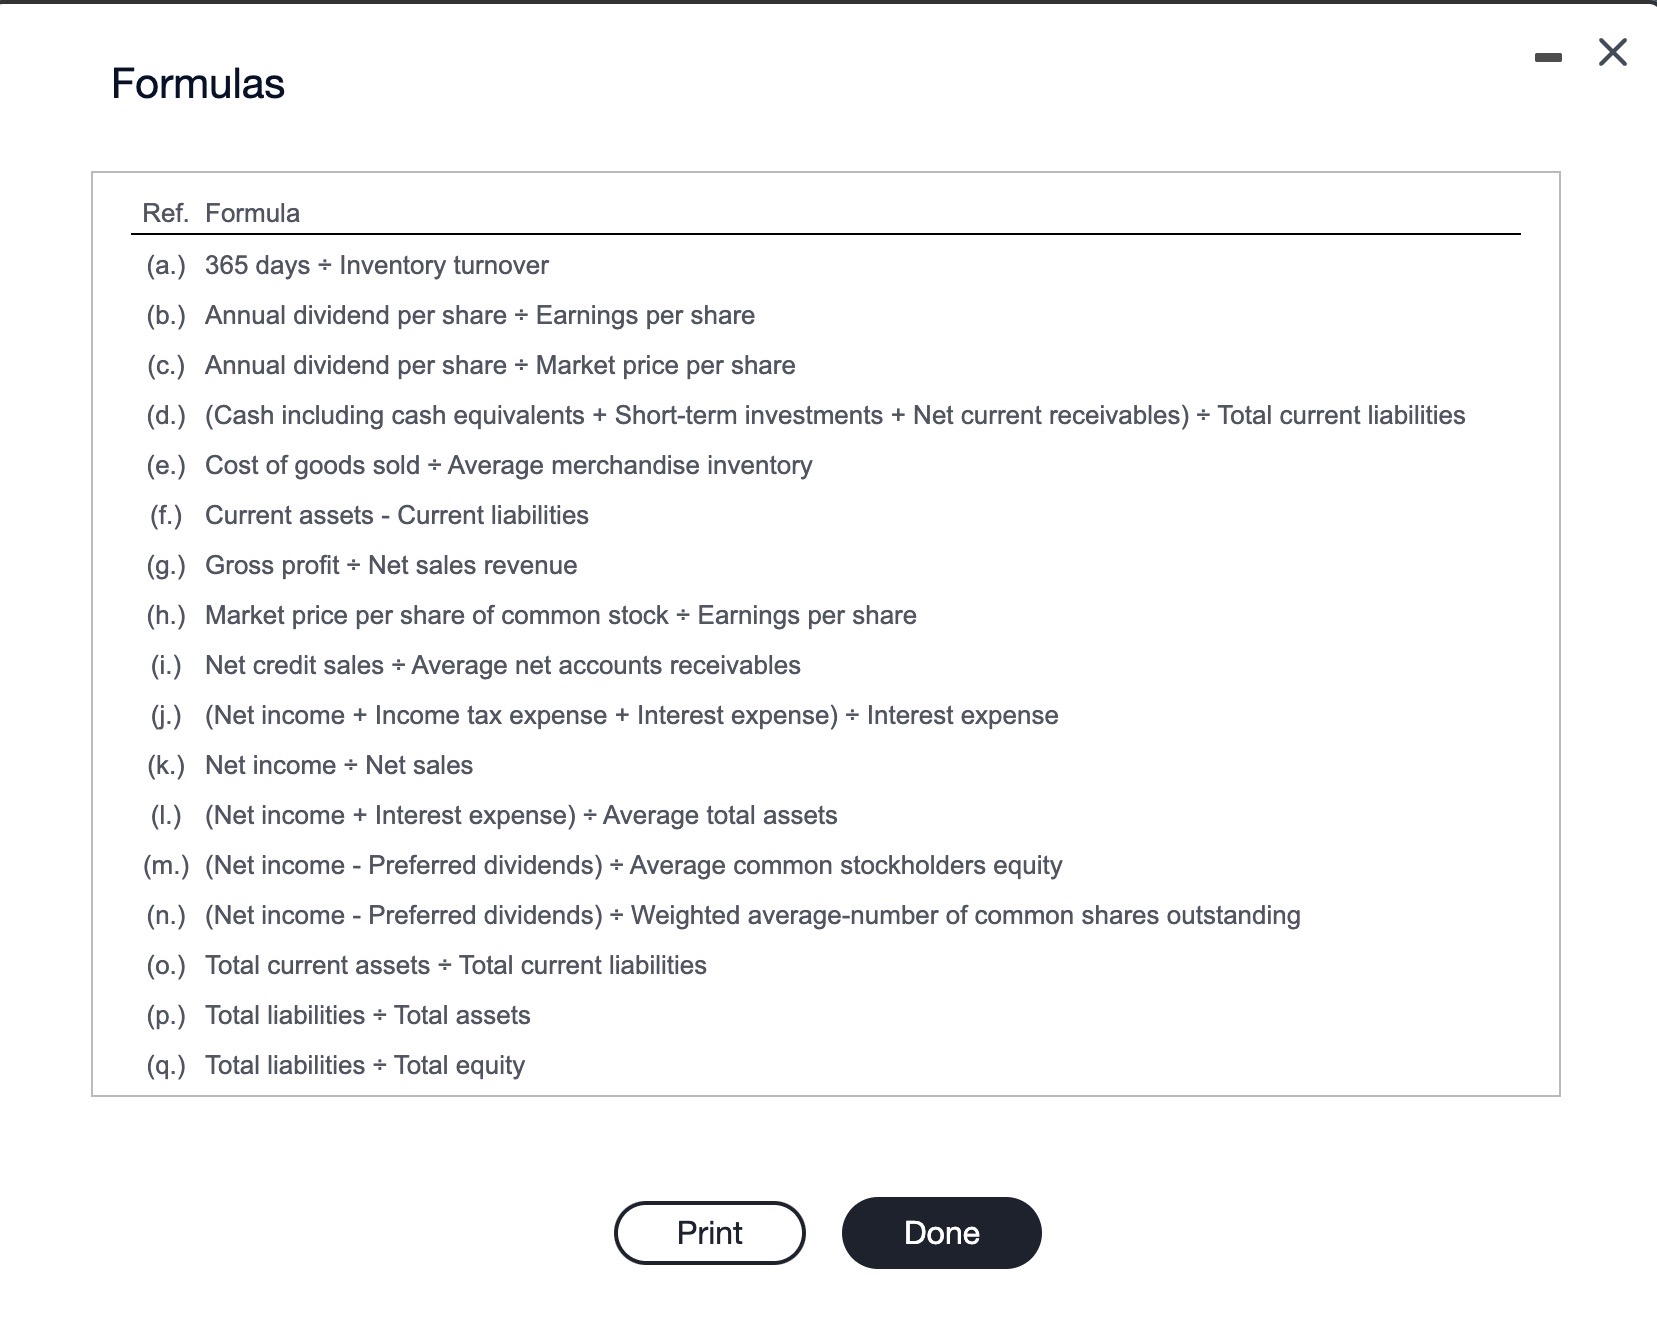
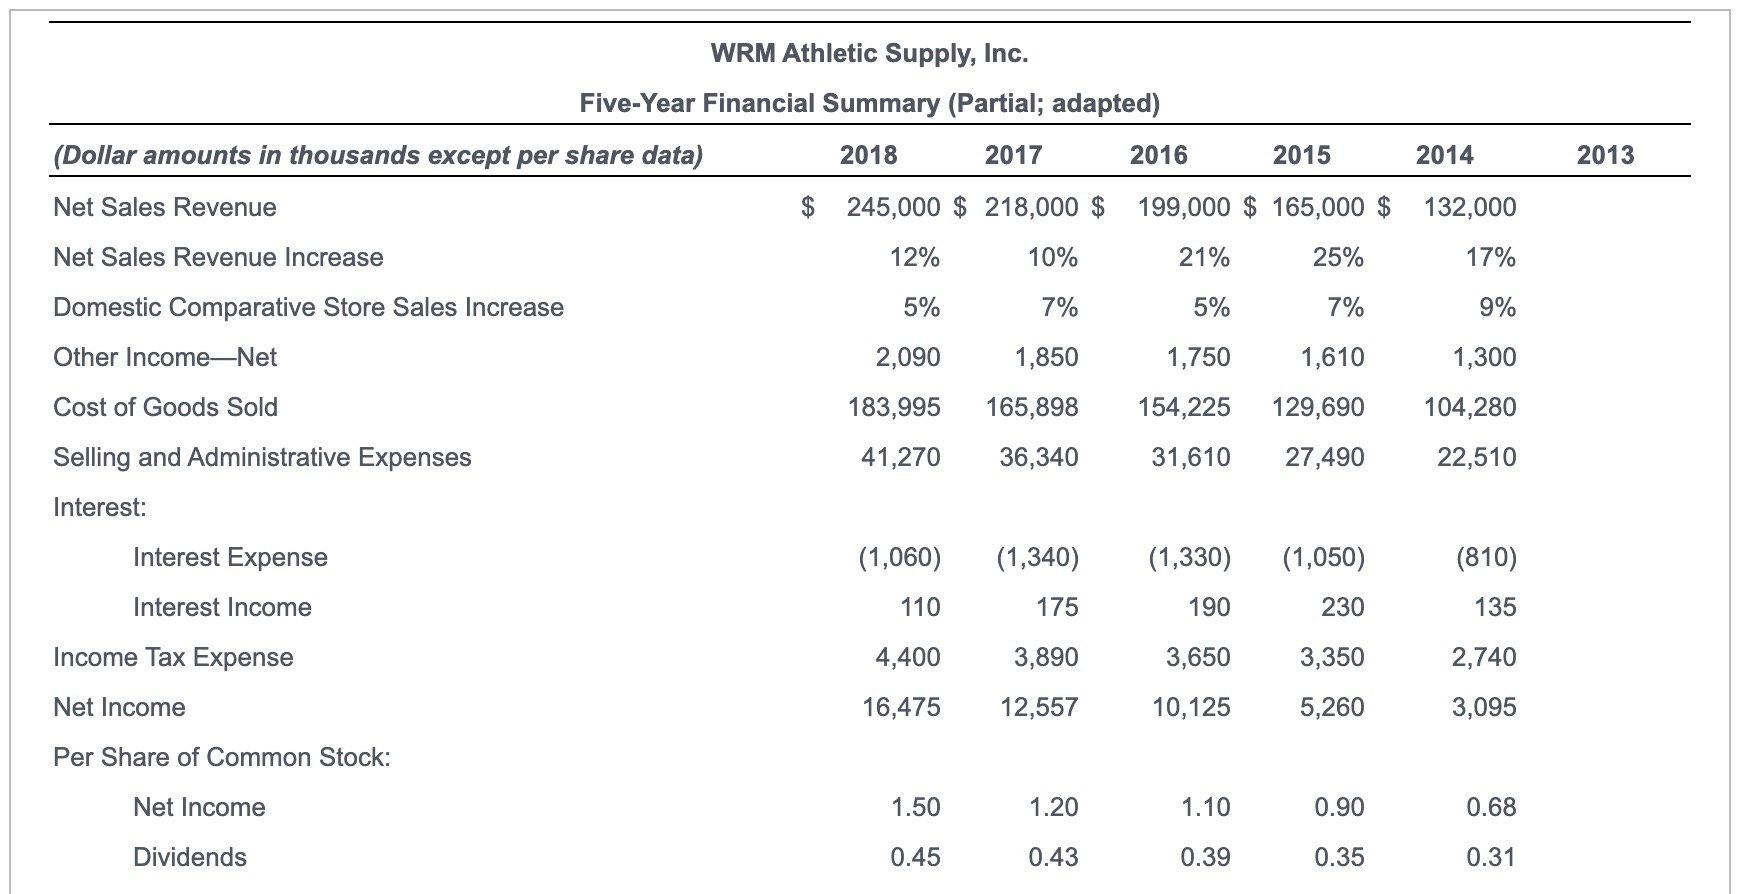
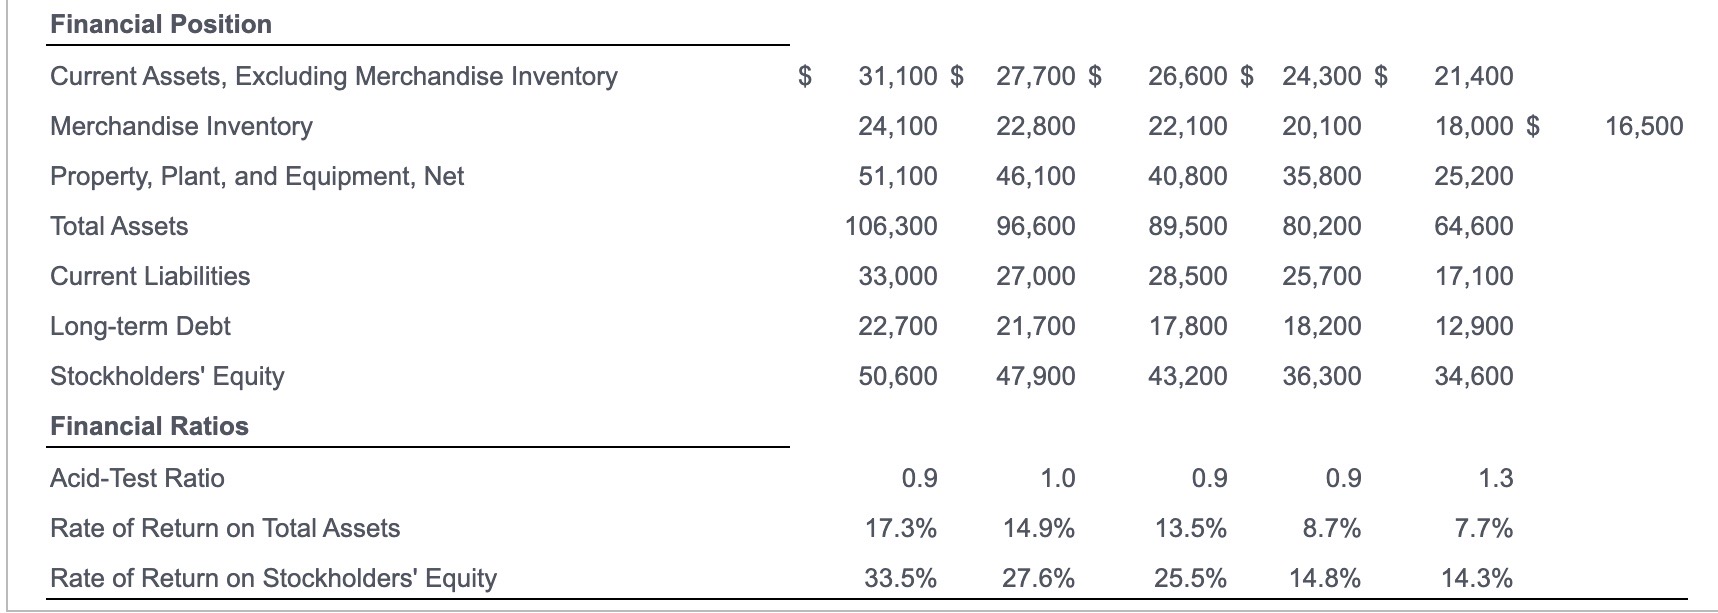
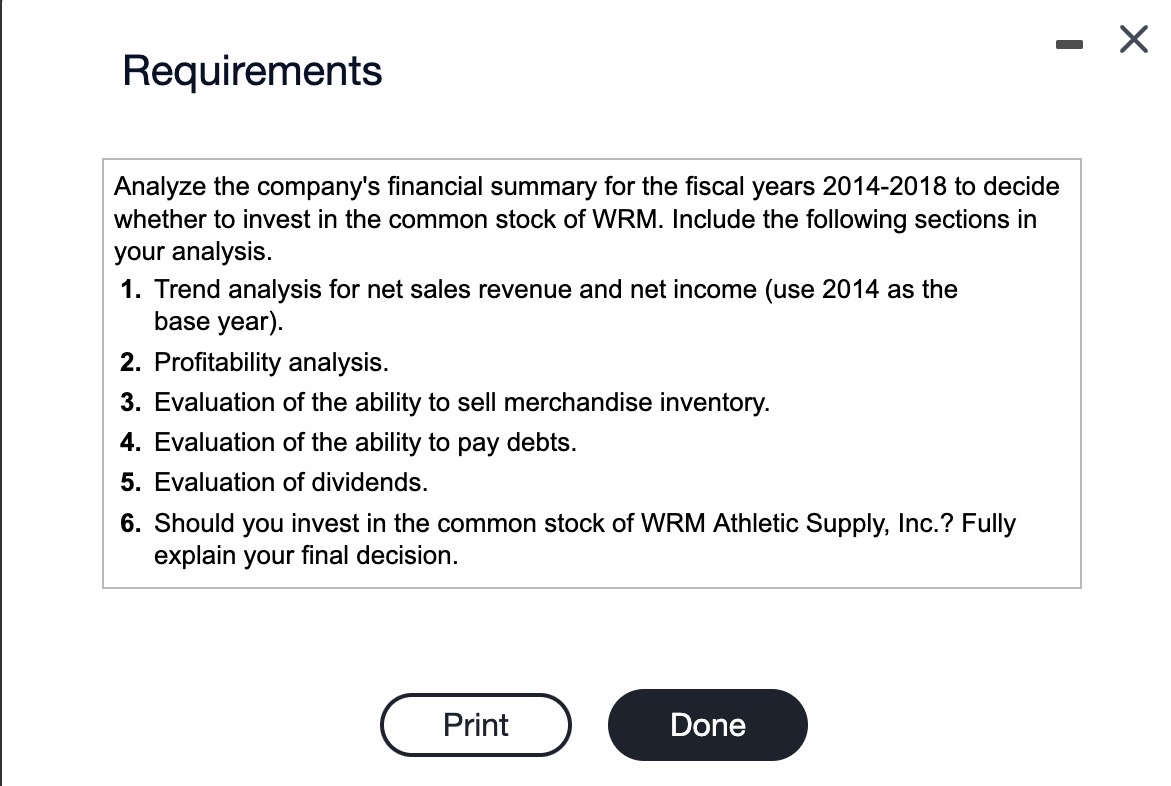
In its annual report, WRM Athletic Supply, Inc. includes the following five-year financial summary: (Click the icon to view the financial summary.) Read the requirements. ... Requirement 1. Compute the trend analysis for net sales and net income (use 2014 as the base year). (Round to the nearest whole percent.) 2018 2017 2016 2015 2014 Net sales 186 % 165 % 151 % 125 % 100 % Net income 532 % 406 % 327 % 170 % 100 % Trends in net sales and net income are both upward which is positive Requirement 2. Compute the profitability analysis. Begin by selecting the appropriate measurements that should be used to complete a profitability analysis. Profit margin ratio Rate of return on total assets Rate of return on common stockholders' equity Earnings per share of common stock Select the formula reference in the last column of the table and enter the earnings per share for each year. (Round to the nearest cent, X.XX.) (Click the icon to view the formulas.) 2018 2017 2016 2015 2014 Earnings per share $ 1.50 $1.20 $ 1.10 $ 0.90 0.68 Formula (n.) Select the formula reference in the last column of the table and compute the profit margin ratio for all five years. (Enter your answers as percentages rounded to the nearest tenth percent, X.X%.) (Click the icon to view the formulas.) Select the formula reference in the last column of the table and enter the earnings per share for each year. (Round to the nearest cent, X.XX.) (Click the icon to view the formulas.) 2018 2017 2016 2015 2014 Earnings per share $ 1.50 $1.20 $ 1.10 $ 0.90 0.68 Formula (n.) Select the formula reference in the last column of the table and compute the profit margin ratio for all five years. (Enter your answers as percentages rounded to the nearest tenth percent, X.X%.) (Click the icon to view the formulas.) 2018 2017 Profit margin ratio 6.7 % 5.8 % 2016 5.1 % 2015 2014 3.2 % 2.3 % Formula (k.) Select the formula reference in the last column of the table and enter the rate of return on total assets and the rate of return on common stockholders' equity for each year. (Enter your answers as percentages to the tenth percent, X.X%.) (Click the icon to view the formulas.) 2018 2017 2016 2015 2014 Formula Rate of return on total assets % % % % % Rate of return on common stockholders' equity % % % % % Formulas Ref. Formula (a.) 365 days + Inventory turnover (b.) Annual dividend per share + Earnings per share (c.) Annual dividend per share + Market price per share (d.) (Cash including cash equivalents + Short-term investments + Net current receivables) + Total current liabilities (e.) Cost of goods sold + Average merchandise inventory (f.) Current assets - Current liabilities (g.) Gross profit + Net sales revenue (h.) Market price per share of common stock + Earnings per share (i.) Net credit sales + Average net accounts receivables (j.) (Net income + Income tax expense + Interest expense) + Interest expense (k.) Net income + Net sales (I.) (Net income + Interest expense) + Average total assets (m.) (Net income - Preferred dividends) + Average common stockholders equity (n.) (Net income - Preferred dividends) + Weighted average-number of common shares outstanding (o.) Total current assets + Total current liabilities (p.) Total liabilities + Total assets (q.) Total liabilities + Total equity Print Done - WRM Athletic Supply, Inc. Five-Year Financial Summary (Partial; adapted) (Dollar amounts in thousands except per share data) Net Sales Revenue Net Sales Revenue Increase Domestic Comparative Store Sales Increase Other Income-Net Cost of Goods Sold Selling and Administrative Expenses 2018 2017 2016 2015 $ 245,000 $ 218,000 $ 199,000 $ 165,000 $ 2014 2013 132,000 12% 10% 21% 25% 17% 5% 7% 5% 7% 9% 2,090 1,850 1,750 1,610 1,300 183,995 165,898 154,225 129,690 104,280 41,270 36,340 31,610 27,490 22,510 Interest: Interest Expense (1,060) Interest Income 110 (1,340) 175 (1,330) (1,050) (810) 190 230 135 Income Tax Expense 4,400 3,890 3,650 3,350 2,740 Net Income 16,475 12,557 10,125 5,260 3,095 Per Share of Common Stock: Net Income Dividends 1.50 1.20 1.10 0.90 0.68 0.45 0.43 0.39 0.35 0.31 Financial Position Current Assets, Excluding Merchandise Inventory 31,100 $ 27,700 $ 26,600 $ 24,300 $ 21,400 Merchandise Inventory 24,100 22,800 22,100 20,100 18,000 $ 16,500 Property, Plant, and Equipment, Net 51,100 46,100 40,800 35,800 25,200 Total Assets 106,300 96,600 89,500 80,200 64,600 Current Liabilities Long-term Debt Stockholders' Equity 33,000 27,000 28,500 25,700 17,100 22,700 21,700 17,800 18,200 12,900 50,600 47,900 43,200 36,300 34,600 Financial Ratios Acid-Test Ratio 0.9 1.0 0.9 0.9 1.3 Rate of Return on Total Assets 17.3% 14.9% 13.5% 8.7% 7.7% Rate of Return on Stockholders' Equity 33.5% 27.6% 25.5% 14.8% 14.3% Requirements Analyze the company's financial summary for the fiscal years 2014-2018 to decide whether to invest in the common stock of WRM. Include the following sections in your analysis. 1. Trend analysis for net sales revenue and net income (use 2014 as the base year). 2. Profitability analysis. 3. Evaluation of the ability to sell merchandise inventory. 4. Evaluation of the ability to pay debts. 5. Evaluation of dividends. 6. Should you invest in the common stock of WRM Athletic Supply, Inc.? Fully explain your final decision. Print Done
Step by Step Solution
There are 3 Steps involved in it
Step: 1

Get Instant Access to Expert-Tailored Solutions
See step-by-step solutions with expert insights and AI powered tools for academic success
Step: 2

Step: 3
Ace Your Homework with AI
Get the answers you need in no time with our AI-driven, step-by-step assistance
Get Started
Intermediate Accounting
Authors: kieso, weygandt and warfield.
14th Edition
9780470587232, 470587288, 470587237, 978-0470587287