Question
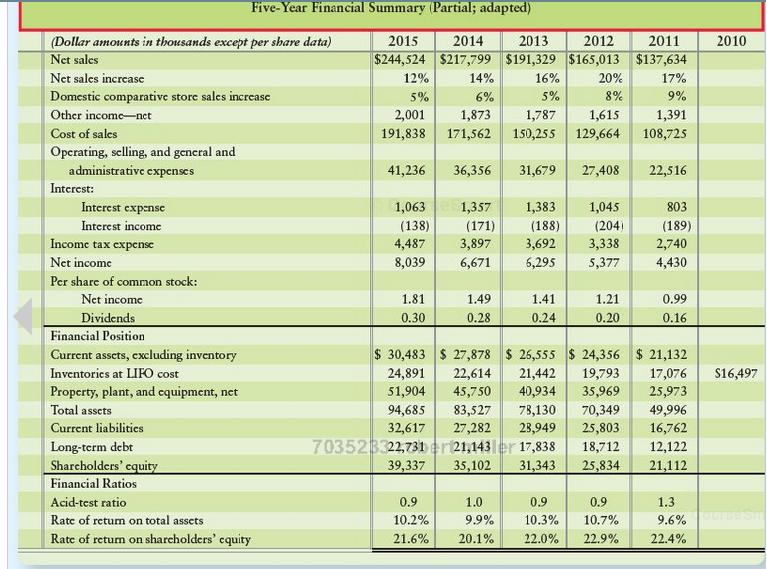
In its Annual report, WRS Athletic Supply inc includes the following five-year financial summary. 1. Analyze the company financial summary for the fiscal years 2011-2015
In its Annual report, WRS Athletic Supply inc includes the following five-year financial summary.
1. Analyze the company financial summary for the fiscal years 2011-2015 to decide whether to invest in the common stock of WRS include the following sections in your analysis, and fully explain your decision:
A. Trend analysis for net sales and net income using 2011 as the base year
B. Profitability analysis
C. Measuring ability to sell inventory ( WRS uses the LIFO method )
D. Measuring ability to pay debts.
E Evaluate the dividends

(Dollar amounts in thousands except per share data) Net sales Net sales increase Domestic comparative store sales increase Other income-net Cost of sales Operating, selling, and general and administrative expenses Interest: Interest expense Interest income Income tax expense Net income Per share of common stock: Net income Dividends Financial Position Current assets, excluding inventory Inventories at LIFO cost Property, plant, and equipment, net Five-Year Financial Summary (Partial; adapted) Total assets Current liabilities Long-term debt Shareholders' equity Financial Ratios Acid-test ratio Rate of return on total assets Rate of return on shareholders' equity 2015 2014 2013 2012 $244,524 $217,799 $191,329 $165,013 12% 5% 2,001 191,838 41,236 1,063 (138) 4,487 8,039 1.81 0.30 94,685 32,617 39,337 14% 6% 17% 9% 1,873 1,787 1,615 1,391 171,562 150,255 129,664 108,725 0.9 10.2% 21.6% 36,356 31,679 1,357 (171) 3,897 6,671 16% 5% 1.49 0.28 1,383 (188) 3,692 5,295 1.0 9.9% 20.1% 1.41 0.24 703523322,731 er 21,143 er 17,838 35,102 31,343 20% 8% 27,408 1,045 (204) 3,338 5,377 1.21 0.20 78,130 70,349 83,527 27,282 23,949 25,803 18,712 25,834 $ 30,483 $ 27,878 $25,555 $ 24,356 $ 21,132 24,891 22,614 21,442 19,793 17,076 51,904 45,750 40,934 35,969 25,973 2011 $137,634 0.9 0.9 10.3% 10.7% 22.0% 22.9% 22,516 803 (189) 2,740 4,430 0.99 0.16 49,996 16,762 12,122 21,112 1.3 9.6% 22.4% 2010 $16,497
Step by Step Solution
3.49 Rating (166 Votes )
There are 3 Steps involved in it
Step: 1
A Trend Analysis Dollars amounts in thousands except per share ...
Get Instant Access to Expert-Tailored Solutions
See step-by-step solutions with expert insights and AI powered tools for academic success
Step: 2

Step: 3

Ace Your Homework with AI
Get the answers you need in no time with our AI-driven, step-by-step assistance
Get Started


