Question
In January 2012, Ellen Kullman, CEO and chairman of DuPont, was reviewing an internal report on the company's Performance Coatings division. A month earlier, she
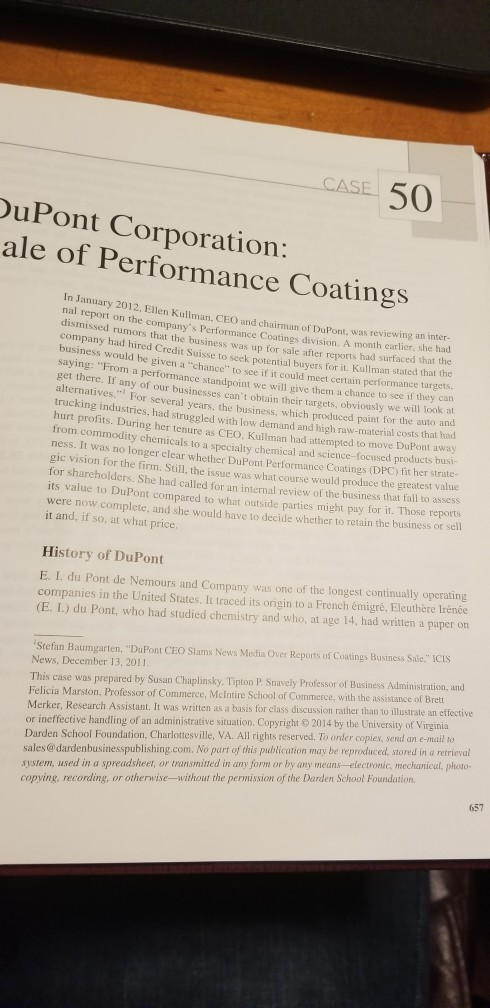
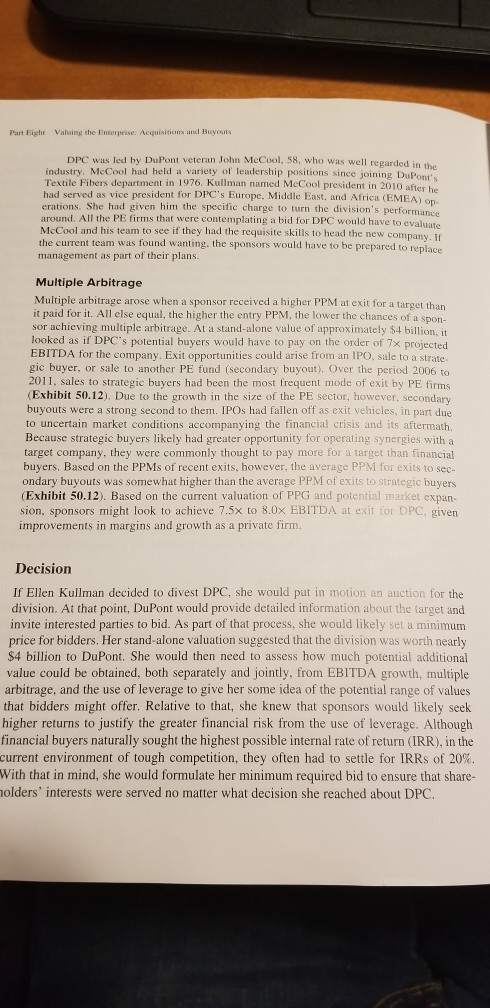
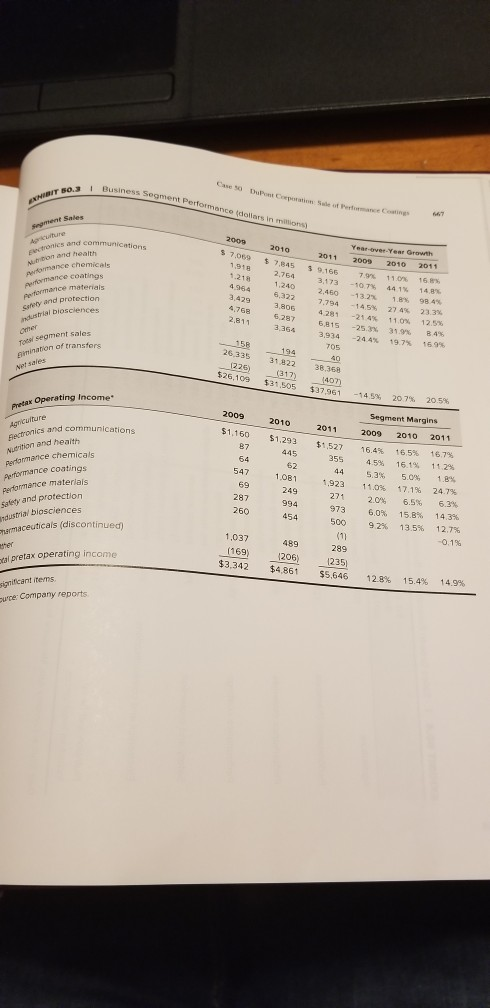
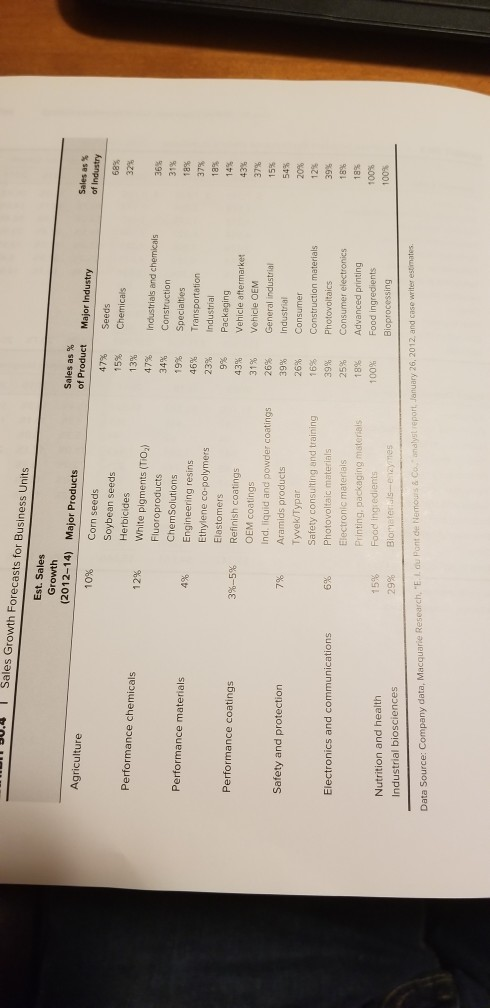
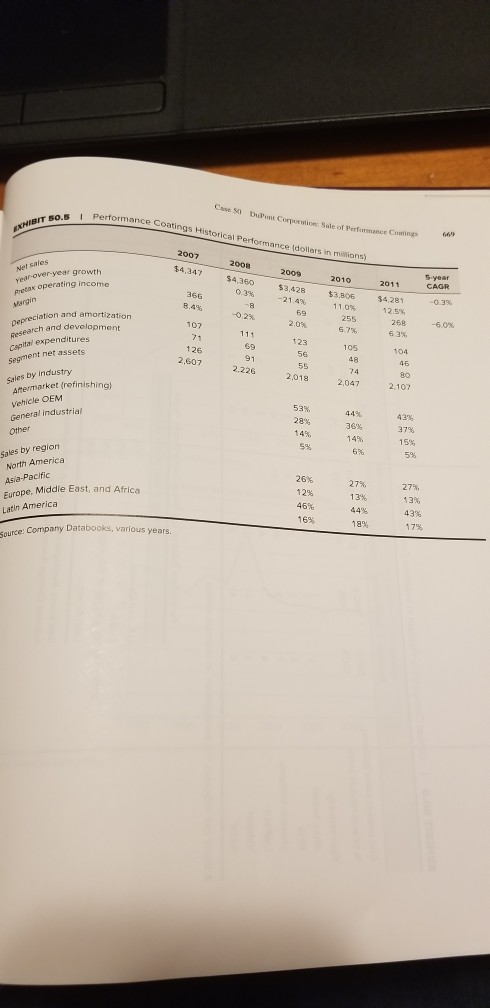
In January 2012, Ellen Kullman, CEO and chairman of DuPont, was reviewing an internal report on the company's Performance Coatings division. A month earlier, she had dismissed rumors that the business was up for sale after reports had surfaced that the company had hired Credit Suisse to seek potential buyers for it. Kullman stated that the business would be given a chance to see if it could meet certain performance targets, saying: From a performance standpoint we will give them a chance to see if they can get there. If any of our businesses can't obtain their targets, obviously we will look at alternatives. For several years, the business, which produced paint for the auto and trucking industries, had struggled with low demand and high raw-material costs that had hurt profits. During her tenure as CEO, Kullman had attempted to move DuPont away from commodity chemicals to a specialty chemical and sciencefocused products business. It was no longer clear whether DuPont Performance Coatings (DPC) fit her strategic vision for the firm. Still, the issue was what course would produce the greatest value for shareholders. She had called for an internal review of the business that fall to assess its value to DuPont compared to what outside parties might pay for it. Those reports were now complete, and she would have to decide whether to retain the business or sell it and, if so, at what price.
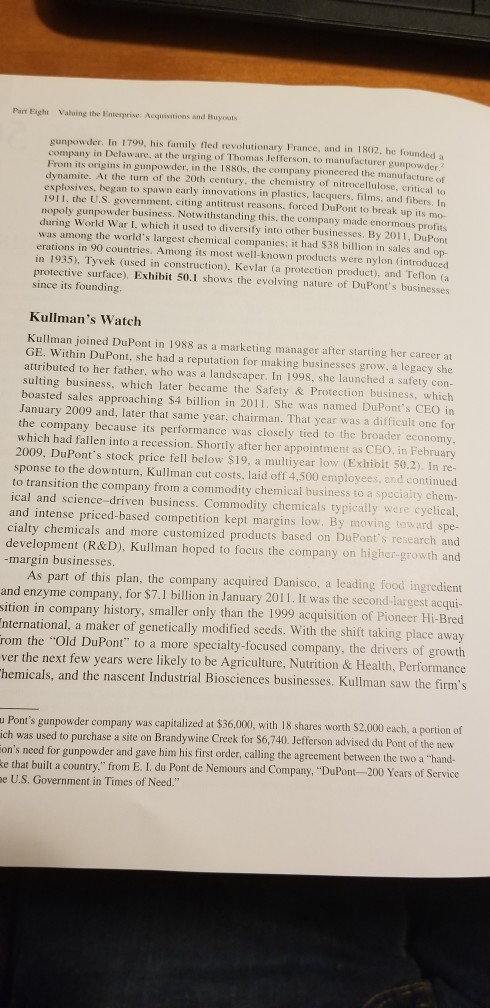
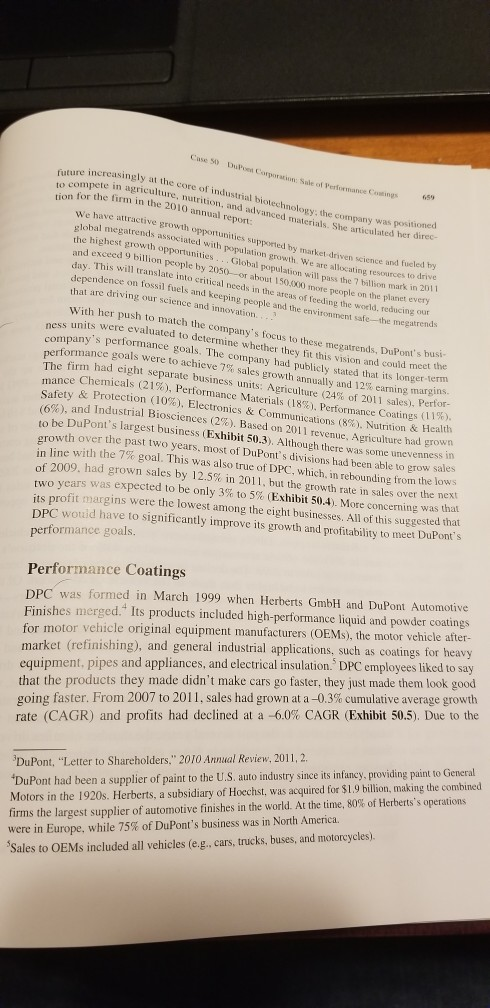
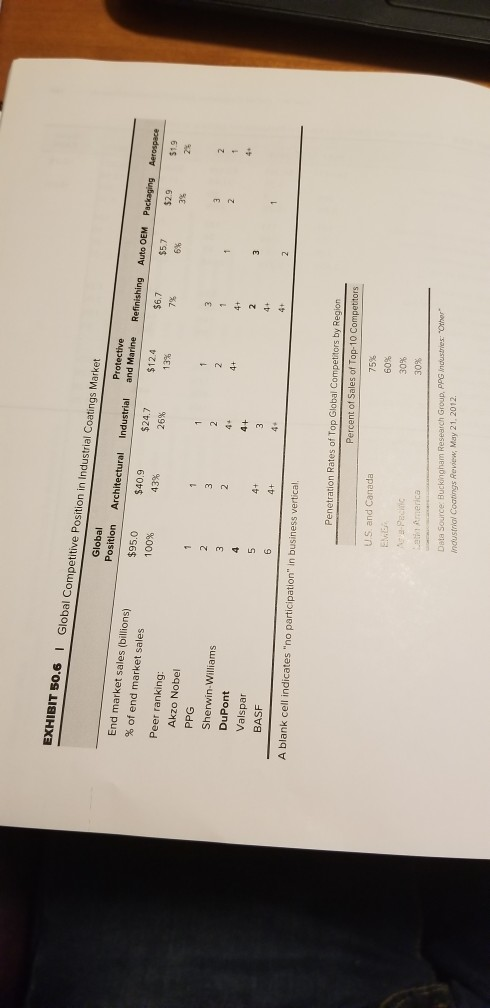
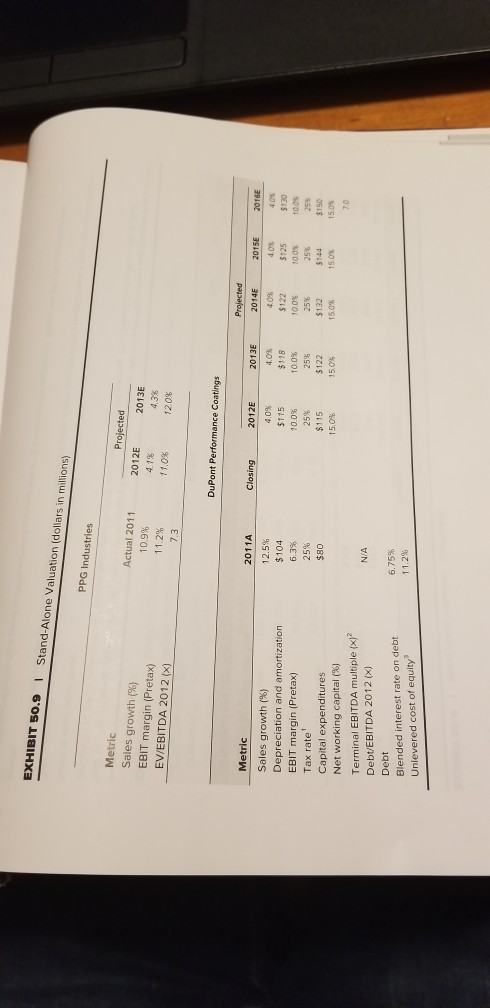
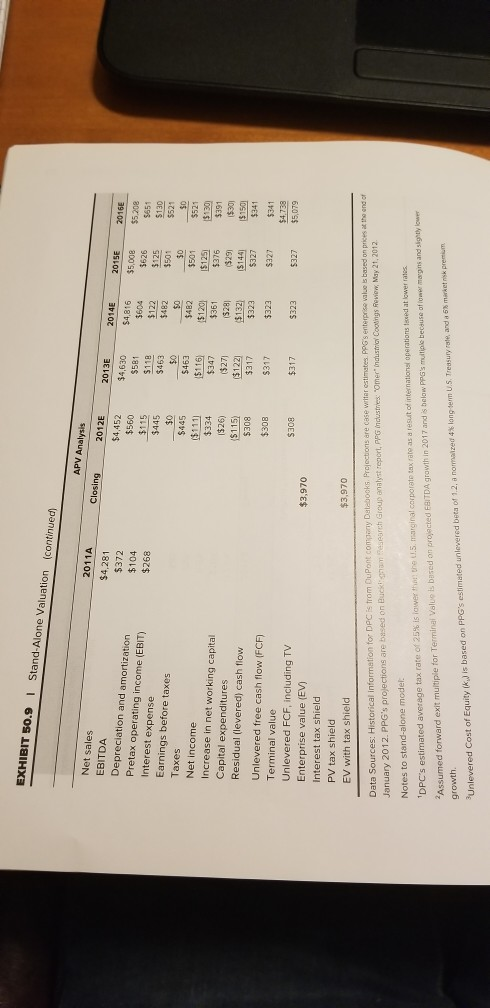
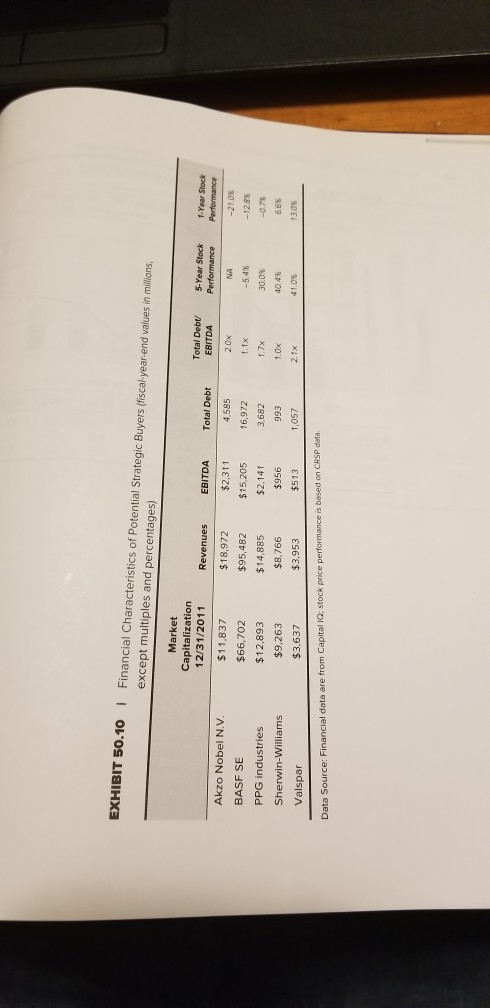
CASE 50 DuPont Corporation: ale of Performance Coatings ed Credit Suissess was up for sale after or sale after reports had surfaced that the Perfomchancek porr salean Sion A in January 2012. Ellen Kullman CEO and chairman of DuPont, was reviewing an nal report on the company's Performance Coatings division the company's Performance Coatines division. A month carlier. She had dismissed rumors that the business was un for sale after recorts had surfaced company had hired Credit Suisse potential buvers for it. Kullman stated that the business would be given a chance to see if it could meet certain performance are saying from a performance standen we will pive them a chance to see if they can get there. If any of our business Can't lain their targets, obviously we will look at alternatives for several years the business which produced paint for the auto ang trucking industries, had single with a demand and high raw material costs that had hurt profits. During her tenure as CEO, Kullman had attempted to move DuPont away from commodity chemicals to a specialty chemical and science-focused products busi ness. It was no longer clear whether DuPont Performance Coatings (DPC) fit her strate gic vision for the firm. Still, the issue was what course would produce the greatest value for shareholders. She had called for an internal review of the business that fall to assess its value to DuPont compared to what outside parties might pay for it. Those reports were now complete, and she would have to decide whether to retain the business or sell it and, if so, at what price, History of DuPont E. I. du Pont de Nemours and Company was one of the longest continually operating companies in the United States. It traced its origin to a French migr, Eleuthere Irne (E.I.) du Pont, who had studied chemistry and who, at age 14, had written a paper on Stefan Baumgarten, "DuPont CEO Slams News Media Over Reports of Coatings Business Sale." ICIS News, December 13, 2011 This case was prepared by Susan Chaplinsky, Tipton P Snavely Professor of Business Administration, and Felicia Marston, Professor of Commerce, McIntire School of Commerce, with the assistance of Brett Merker, Research Assistant. It was written as a basis for class discussion rather than to illustrate an effective or ineffective handling of an administrative situation. Copyright 2014 by the University of Virginia Darden School Foundation, Charlottesville, VA. All rights reserved. To order copies, send an e-mail to sales@dardenbusinesspublishing.com. No part of this publication may be reproduced, stored in a retrieval system, used in a spreadsheet, or transmitted in any form or by any means-electronic, mechanical, photo copying, recording, or otherwise-without the permission of the Darden School Foundation, 657 Part Fight Valuing the Enterprise Acquisitions and you gunpowder. In 1799, his family fled revolutionary France, and in 1802, he founded company in Delaware, at the urging of Thomas Jefferson to manufacturer gunpowder From its origins in gunpowder, in the 1880s, the company pioneered the manufacturer dynamite. At the turn of the 20th century, the chemistry of nitrocellulose, critical explosives, began to spawn early innovations in plastics, lacquers, films, and fiber in 1911. the US government, citing antitrust reasons, forced DuPont to break up its mo- nopoly gunpowder business. Notwithstanding this, the company made enormous profits during World War I, which it used to diversify into other businesses. By 2011. DuPont was among the world's largest chemical companies; it had $38 billion in sales and op- erations in 90 countries. Among its most well-known products were nylon introduced in 1935). Tyvek (used in construction). Kevlar (a protection product), and Teflon (a protective surface). Exhibit 50.1 shows the evolving nature of DuPont's businesses since its founding. Kullman's Watch Kullman joined DuPont in 1988 as a marketing manager after starting her career at GE. Within DuPont, she had a reputation for making businesses grow, a legacy she attributed to her father, who was a landscaper. In 1998, she launched a safety con- sulting business, which later became the Safety & Protection business, which boasted sales approaching $4 billion in 2011. She was named DuPont's CEO in January 2009 and, later that same year, chairman. That year was a difficult one for the company because its performance was closely tied to the broader economy. which had fallen into a recession. Shortly after her appointment as CEO in February 2009. DuPont's stock price fell below $19, a multiyear low Exhibit 50.2). In re- sponse to the downturn, Kullman cut costs, laid off 4.500 employees, and continued to transition the company from a commodity chemical business to a specialty chem- ical and science-driven business. Commodity chemicals typically were cyclical, and intense priced-based competition kept margins low. By moving toward spe- cialty chemicals and more customized products based on DuPont's research and development (R&D), Kullman hoped to focus the company on higher-growth and -margin businesses. As part of this plan, the company acquired Danisco, a leading food ingredient and enzyme company, for $7.1 billion in January 2011. It was the second largest acqui- sition in company history, smaller only than the 1999 acquisition of Pioneer Hi-Bred nternational, a maker of genetically modified seeds. With the shift taking place away From the "Old DuPont" to a more specialty-focused company, the drivers of growth ver the next few years were likely to be Agriculture, Nutrition & Health, Performance Chemicals, and the nascent Industrial Biosciences businesses. Kullman saw the firm's u Pont's gunpowder company was capitalized at $36.000, with 18 shares worth $2,000 each, a portion of ich was used to purchase a site on Brandywine Creek for $6,740. Jefferson advised du Pont of the new Hon's need for gunpowder and gave him his first order, calling the agreement between the two a "hand- ke that built a country," from E.I. du Pont de Nemours and Company. "DuPont-200 Years of Service ne U.S. Government in Times of Need." Case) Du future increasing r ing her to come 59 increasingly at the core of industrial biotechnology the wy was post w ete in agriculture, nutrition, and wvanced materials. She articulated her dire and for the firm in the 2010 annual report We have a ctive growth opportunities supported by the science and fucked by clobal megatrends associated with population growth We are allo TCVTCe 10 an the highest growth opportunities ... Global population will the Million war's in 20 and exceed 9 billion people by 205)-or about 1 ) oreople on the planet every day. This will translate into critical needs in the areas of feeling the world, reducing out dependence on fossil fuels and keeping people and the em fe-the megatrends that are driving our science and innovation wth opportunities culation growth. We are driven science a fossil fuels and cal needs in the With her push to match the company's focus to these megatrends, DuPont's bus -55 units were evaluated to determine whether they fit this vision and could meet the company's performance goals. The company had publicly stated that its longer-term erformance goals were to achieve 7% sales growth anwally and 12 earning margins The firm had eight separate business units: Agriculture (24% of 2011 sales). Perfor- uance Chemicals (21%). Performance Materials (18%). Performance Coatings (11%), Safety & Protection (10%). Electronics & Communications (8%). Nutrition & Health (6%), and Industrial Biosciences (2%). Based on 2011 revenue, Agriculture had grown to be DuPont's largest business Exhibit 50.3). Although there was some unevenness in rowth over the past two years, most of DuPont's divisions had been able to grow sales in line with the 7% goal. This was also true of DPC, which, in rebounding from the lows of 2009, had grown sales by 12.5% in 2011, but the growth rate in sales over the next two years was expected to be only 3% to 5% (Exhibit 50.4). More concerning was that its profit margins were the lowest among the eight businesses. All of this suggested that DPC would have to significantly improve its growth and profitability to meet DuPont's Is (21 paraleleve recomand they ction Go Perrosiness les growd Public performance goals. Performance Coatings DPC was formed in March 1999 when Herberts GmbH and DuPont Automotive Finishes merged." Its products included high-performance liquid and powder coatings for motor vehicle original equipment manufacturers (OEMs), the motor vehicle after- market (refinishing), and general industrial applications, such as coatings for heavy equipment, pipes and appliances, and electrical insulation. DPC employees liked to say that the products they made didn't make cars go faster, they just made them look good going faster. From 2007 to 2011, sales had grown at a-0.3% cumulative average growth rate (CAGR) and profits had declined at a 6.0% CAGR (Exhibit 50.5). Due to the DuPont, "Letter to Shareholders," 2010 Annual Review, 2011, 2. *DuPont had been a supplier of paint to the U.S. auto industry since its infancy, providing paint to General Motors in the 1920s. Herberts, a subsidiary of Hoechst, was acquired for $1.9 billion, making the combined firms the largest supplier of automotive finishes in the world. At the time, 80% of Herberts's operations were in Europe, while 75% of DuPont's business was in North America. Sales to OEMs included all vehicles (e.g., cars, trucks, buses, and motorcycles). aged cars that w ("totaled) and in cars more frequen mated 7 of dan lated to 80.000 the quality of pai weathering Also reducing the demand for paint was Sinificant d it the number of dam eurs that were refinished. This was due to more damaged as being written wled) and msurance companies imposine bicher deductibles such that damage more frequently went without repair in the United Kingdom for example, 74 of damaged cars were written of in 2016 and in 2 that trans to 80.000 fewer cars requiring repair and it cry year. Further, wvances quality of paint used by OEMs made it more durable and resistant to scratches and production in American vehicle units). Overton (13.5 min to recov The OEM market had experienced a sharp decline in global motor vehicle duction in 2009 that had since begun to recover Exhibit 50.8) In 2011. Non merican vehicle production (13.5 million units) still fall host of its 2007 love 155 million units). Over the past decade, most of the growth in vehicle produc- an had taken place in countries outside the United States, particularly in emers markets. For example, between 2000 and 2010, China and India had experienced astonishing 7636 and 344% increase, respectively in vehicle manufacturing DP'S existing customer base was heavily concentrated in Detroit, but North merica accounted lor only 27% of its revenues. As vehicle manufacturing contin od to grow outside North America, DPC's revenues would likely expand in those an astonishing 7630 6 and 344 en 2000 and 2nited State omer base increase re2010. China es particul markets. PPC's overall revenues were closely tied to GDP growth, which was expected he 1% to 2% in 2012-13 in the United States, largely flat in Europe, and more nositive but erratic in emerging markets. Most analysts expected that emerging- market growth coupled with unprecedented fleet aging would spur a recovery in vehicle sales on the order of 3% to 5% per year. Increases in sales, however, did not necessarily translate into higher profits for several reasons. First, the OEM profit margins were set by multiyear contracts with vehicle manufacturers, which made it difficult for paint suppliers to quickly pass on raw material price increases. By com- parison, the margins in refinishing were primarily based on claims paid by insurance companies, which left consumers less price sensitive to repair costs. Second, grow- ing concerns about lead, the high cost of treating airborne emissions and solid haz- ardous waste generated by paint operations, and new regulations covering the global chemical industry in Europe were all expected to increase environmental compliance costs gradually over time. Although a bullish scenario could be concocted for DPC, industry trends suggested that stable to modest improvement was the more likely course for the business over the next several years. As part of the internal review, DuPont attempted to assess DPC'S value if it remained a division of the company. DuPont's internal targets for DPC were annual revenue growth of 3% to 5% and operating margins of 10% to 12%. Given DPC'S mixed track record of performance, the internal review set targets at 4% for growth and 10% for margins, the low end of the targeted range. Other assumptions underlying the stand-alone valuation were incorporated into the analysis itself (Exhibit 50.9) and Together yielded a value of approximately $4 billion for the division. Morgan Stanley. "E. I. du Pont de Nemours & Co.," analyst report, February 13, 2012 Morgan Stanley, 5. Putihi Valine the Inter Acquisitions and Buy company's exposure to the auto sector, sales and earnings had been adversely affected by the 2008 and 2009 downturn. In 2011, the company posted stronger revenue growth of 12.5, but most of this was attributed to price increases, which were unlikely to con tinue. Notwithstanding the pickup in sales, operating margins remained muted because of rising input costs. Nearly 50% of the key raw material inputs (eg.. hydrocarbon sol vents and organic pigments) were tied to crude oil prices, which had risen since the middle of 2010 due to tight supply and improving economic conditions. Key competitive factors in its business included technology and technical exper- tise, product innovation and quality, breadth of product line, service, and price. In most industrial applications, the coating itself was only a small part of total production costs (e... 10% to 15%). and most customers were willing to pay more for technologically advanced coatings if it reduced application costs (eg.. labor). The industry in general was also not highly capital-intensive-capital expenditures and R&D were relatively small in comparison to the variable costs of production DPC held the number-four position in the global industrial coatings market, where it faced strong competition in all the business verticals that made up the industry (Exhibit 50.6). The market was highly fragmented: two companies-PPG Industries and Akzo Nobel N.V., each with sales greater than $10 billion-together accounted for 25% of industry sales. Seventeen firms had sales between $1 billion and S10 billion, the range of DPC's sales, which accounted for 45% of sales. The remainder of sales came from over 60 additional firms. Given the increased pressures for cutting costs and find ing higher-growth opportunities, over the last six years, the industry had been consoli- dating: the market share of the six top companies increased from 28% in 2005 to 35% in 2011. The top-10 global competitors controlled 60% to 75% of the sales in U.S. and European markets. To varying degrees, all the top competitors saw opportunities for growth in the less saturated Asia-Pacific and Latin American markets. Relative to peers. DPC's strengths were in refinishing and the vehicle OEM mar- ket. In 2011, the vehicle aftermarket accounted for 43% of the division's sales, down from 53% of sales in 2009. The decline in refinishing was of concern because its profit margins tended to be higher than those in the vehicle OEM market. Or the $7 billion global refinishing market, PPG and DuPont were the market leaders-cach had ap- proximately a 28% market share-followed by Akzo Nobel (17% market share). Sales to motor vehicle OEMs accounted for 37% of DPC's 2011 sales, and DPC held the number-three market position in the OEM paint market behind PPG and BASF SE. The two key drivers of revenue for these businesses were miles driven and vehi- cle sales. Miles driven was correlated with the incidence of collisions, which affected the demand for paint from refinishing, and sales of vehicles generated demand for paint from OEMs (Exhibit 50.7). Trends in the refinishing market were generally steady to negative. In the past several years, the number of miles driven in the United States had tapered off, resulting in fewer collisions. Potentially offsetting this trend was an expected increase in miles driven-and relatedly, collisions-outside the United States. Buckingham Research Group, PPG Industries: "Other" Industrial Coatings Review, May 21, 2012. 2 Partit Vahing the wri t ions and Blue Potential Buyer's When news surfaced in late October 2011 that DuPont was seeking a potential bu DPC, companies including PPG BASE Ako Nobel, and Valspar Corporation mentioned as prospective strategie buyers. For all but BASF, a potential purchase of billion would be a sizable transaction to complete Exhibit 50.10). In respons question about his county's extential interest. Valspar CEO Gary E. Hendrickson that DPC was a little biebsite for us. Although the $4 billion price tag would De large in the current environment for private equity (PE) firms, Blackstone, Adva International, KKR Co One Corporation, and Clayton. Dubilier & Rice were reportedly considerine bids or had already made inquiries about the division. The inter est from PE firms was not surprisine given that buyout firms were sitting on levels of "dry pwder cumulatively totaling over $400 billion at the end of 2011 large portion of that was concentrated in buyout funds with 2000 and 2007 vintage year In those years, buvau funds had raised record amounts of capital but had found it diff cult to invest in the ensuine crisis vers. As these funds neared the end of their investe periods, their general partners were under increasing pressure to find investments A leveraged buyout (LRO) was the purchase of a firm facilitated by large amount of debt financing. In an LBO, the PE firm or sponsor would arrange debt financing for the deal and contribute the balance of financing with equity from one or more of its funds. Because of the anticipated higher debt load, PE firms generally looked for firms that could readily service the debt. Target characteristics might include steady and pre- dictable cash flows, assets that provided good collateral for debt, or non-core assets that could be sold to pay down debt. Debt support and returns) could also be bolstered if the targets had opportunities to grow EBITDA by increasing sales or cutting costs. For similar reasons, sponsors looked for mature firms that did not seemingly require large amounts of additional capital expenditures or R&D. Most sponsors also looked for a strong management team because they typically were not hands-on operators and had to rely on the target's management to run day-to-day operations. Of course, to make a good return, the sponsor had to increase the target's value above its purchase price over a typically four to five-year period, after which it would seek to exit the investment. Sponsors in PE deals generally looked to three factors to drive returns in their investee companies: benefits from the use of leverage, growth in EBITDA, and multiple arbitrage (i.e., buy at a low multiple and sell at a high multiple). Benefits of Leverage One benefit of leverage was that interest on debt was tax deductible and therefore the cost of debt was lower than the cost of equity. As a result, increasing leverage could produce interest tax shields that enhanced the company's value. The use of leverage Doug Cameron, "Valspar: DuPont Coatings Business Too Big a Bite for Us to Buy." Wall Street Journal, May 14, 2012 At the same time, DuPont hired Greenhill & Co. to handle the sale of a smaller part of the business that handled coatings for tractors and playground equipment. Zachary R. Mider and Jeffrey McCracken "DuPont Is Said to Weigh $4 Billion Sale of Auto-Paint Unit," Bloomberg. October 28, 2011. Partit Valuing the Enterprise: Acquisitions and Buyouts DPC was led by DuPont veteran John McCool, 58, who was well regarded in the industry. MeCool had held a variety of leadership positions since joining DuPont Textile Fibers department in 1976. Kullman named McCool president in 2010 after he had served as vice president for DPC's Europe, Middle East, and Africa (EMEA) op erations. She had given him the specific charge to turn the division's performance around. All the PE firms that were contemplating a bid for DPC would have to evaluate McCool and his team to see if they had the requisite skills to head the new company the current team was found wanting, the sponsors would have to be prepared to replace management as part of their plans. Multiple Arbitrage Multiple arbitrage arose when a sponsor received a higher PPM at exit for a larger than it paid for it. All else equal, the higher the entry PPM, the lower the chances of a spon- sor achieving multiple arbitrage. At a stand-alone value of approximately $4 billion, it looked as if DPC's potential buyers would have to pay on the order of 7x projected EBITDA for the company. Exit opportunities could arise from an IPO, sale to a strate. gic buyer, or sale to another PE fund (secondary buyout). Over the period 2006 to 2011. sales to strategic buyers had been the most frequent mode of exit by PE firms (Exhibit 50.12). Due to the growth in the size of the PE sector, however, secondary buyouts were a strong second to them. IPOs had fallen off as exit vehicles, in part due to uncertain market conditions accompanying the financial crisis and its aftermath. Because strategic buyers likely had greater opportunity for operating synergies with a target company, they were commonly thought to pay more for a target than financial buyers. Based on the PPMs of recent exits, however, the average PPM for exits to see- ondary buyouts was somewhat higher than the average PPM of exits to strategic buyers (Exhibit 50.12). Based on the current valuation of PPG and potential market expan- sion, sponsors might look to achieve 7.5x to 8.0X EBITDA at exit for DPC, given improvements in margins and growth as a private firm. Decision If Ellen Kullman decided to divest DPC, she would put in motion an auction for the division. At that point, DuPont would provide detailed information about the target and invite interested parties to bid. As part of that process, she would likely set a minimum price for bidders. Her stand-alone valuation suggested that the division was worth nearly $4 billion to DuPont. She would then need to assess how much potential additional value could be obtained, both separately and jointly, from EBITDA growth, multiple arbitrage, and the use of leverage to give her some idea of the potential range of values that bidders might offer. Relative to that, she knew that sponsors would likely seek higher returns to justify the greater financial risk from the use of leverage. Although financial buyers naturally sought the highest possible internal rate of return (IRR), in the current environment of tough competition, they often had to settle for IRRs of 20%. With that in mind, she would formulate her minimum required bid to ensure that share- lolders' interests were served no matter what decision she reached about DPC. Businessment Performance (dois in Cette partie en ENNT BO ons and communications 2009 $7. 00 2010 1.918 1.218 $7,345 2.764 2011 16 3,123 and health c ance chemicals romance coatings romance materials y and protection trial biosciences 4.964 2.429 4,768 2,811 1.240 5.322 3.805 5.27 3364 Year 2009 7800 -1076 -13.2 -145 -21.45 253 - 2942 Year Growth 2010 2011 11.00 15.000 44 18 14.8% 1.8 98.4% 2745 23 11.04 12 .5% 319 B4% 197% 16.96 5,815 3,934 Tot segment Sales misation of transfers - 156 705 26 335 Net ses 1226) 126 109 31.822 (317) $31.505 38.368 407 $37.961 -14 % 207% - Operating Income. 20.5% Segment Margins Agriculture 2009 $1,160 2011 monics and communications 2010 $1.293 2009 445 $1527 355 62 Nutrition and health performance chemicals Performance coatings performance materials Sally and protection dustrial biosciences 1.081 547 69 287 260 1.923 274 973 500 249 994 454 2010 2011 65% 15.7% 16.1% 11.2% 5.0% 1.8% 17.1% 24.7% 65% 6.3% 15.8% 14.3% 13.5% 12.7% 16.4% 45% 5.3% 11.09 20% 60% 92% Camaceuticals (discontinued 1,037 (169) -0.1% 489 1206) 289 al pretax operating income $3,342 1235) $4,861 $5.646 12.8% 15,4% 14.9% significant items Surse: Company reports Performance Coatings Historical Performance doors in millions) DuPont C Copa owo Sale of EXHIBIT 50.5 Sule of Performance Coin Net sales 2007 $4.347 2008 $4.360 0.3% ar-over-year growth operating income 2010 5 year 2011 366 2009 $3.42 21.4% 59 2.05 argin -0.3% preciation and amortization search and development $3,806 110% 255 573 $4281 12.5% 268 6.3 -60% 107 71 126 2.607 123 capital expenditures Segment net assets 105 56 104 69 91 2.226 55 46 74 2,018 Sales by industry Amermarket (refinishing 2.047 BO 2.102 Vehicle OEM General industrial 44% 43% Other 37% 14% 15% 59 Sales by region North America Asia-Pacific 266 12% 27% Europe, Middle East and Africa Latin America 46% 27% 13% 43% 13% 44% 16% Source: Company Databooks, various years. 189 179 Global $40,9 Refinishing 100% Auto OEM $124 Packaging EXHIBIT 50.6 | Global Competitive Position in Industrial Coatings Market Protective Position Architectural Industrial and Marine End market sales (billions) $95.0 $24.7 % of end market sales 43% 26% 13% Peer ranking: Akzo Nobel PPG Sherwin-Williams $6.7 Aerospace $5.7 6% $2.9 519 N- DuPont Valspar BASF A blank cell indicates "no participation in business vertical, Penetration Rates of Top Global Competitors by Region Percent of Sales of Top-10 Competitors 75% U.S. and Canada EME Pecc Latin America 60% 30% 30% Data Source: Buckingham Research Group, PPG Industries: "Other" industrial Coatings Review, May 21, 2012. EXHIBIT 50.9 Stand Alone Valuation dollars in millions) PPG Industries Metric Sales growth (%) EBIT margin (Pretax) EV/EBITDA 2012(X) Actual 2011 10.9% 11.2% Projected 2012E 2013E 4.1% 43% 11.0% 120% 7.3 DuPont Performance Coatings Closing 2012 Projected 2014 2015 2016 2011A 12.5% $104 6.3% 25% 4.0% $125 2013 4.0% $118 10.0% 25% $122 15.0% Metric Sales growth (%) Depreciation and amortization EBIT margin (Pretax) Tax rate' Capital expenditures Net working capital (%) Terminal EBITDA multiplex Debt/EBITDA 2012 (X) Debt Blended interest rate on debt Unlevered cost of equity $115 10.0% 25% $115 15.0% 100% 4.0% $122 10.0% 25% $132 15.0% $80 $120 1005 255 $150 150% 70 $144 15.0% N/A 6.75% 11.2% EXHIBIT 50.9 1 Stand Alone Valuation continued) 2011A $4,281 $372 $104 $268 APV Analysis Closing 2012 $4,452 $560 2013E $115 $445 $0 $445 Net Sales EBITDA Depreciation and amortization Pretax operating income (EBIT) Interest expense Earnings before taxes Taxes Net income Increase in net working capital Capital expenditures Residual (levered) cash flow Unlevered free cash flow (FCF) Terminal value Unlevered FCF, including TV Enterprise value (EV) Interest tax shield PV tax shield EV with tax shield $4,630 $581 $118 $463 __$0 $463 $116 $347 ($271 ($122 $317 $317 2014 $4,816 $604 5122 $482 $0 $482 $120 $361 ($281 $132) $323 $323 2015E $5,000 $626 $125 $501 $0 $501 $125 $376 ($29 $144 $327 $334 1926) ($115) $308 $308 2016 $5.208 $651 $130 $521 $0 $521 $130 $391 $30 $150 $341 $341 $4.738 $5,079 $327 $308 $317 $323 $327 $3,970 $3,970 January 2012. PPG's projections are based on Bucaram Data Sources: Historical information for DPC is from DuPont company Datebooks Projections are case writer estimates. PPG's enterprise value is based on prices at the end of search Group analyst report, PPG industries 'Omer industrial Coatings Review, May 21, 2012. Notes to stand-alone model TDPC's estimated average tax rate of 25% is lower than the marginal corporate tax rate as a result of international operations exed at lower rates 2Assumed forward exit multiple for Terminal value is based on projected EBITDA growth in 2017 and is below PPS's multiple because of lower margins and slightly lower growth Unlevered Cost of Equity (k) is based on PPG's estimated unlevered beta of 1.2, a nomazed 4% long term U.S. Treasury rate and a 5% markers premium EXHIBIT 50.10 | Financial Characteristics of Potential Strategic Buyers (fiscal-year-end values in millions, except multiples and percentages) Total Debt EBITDA 5-Year Stock Performance -Year Stock Performance NA Market Capitalization 12/31/2011 Revenues EBITDA Total Debt Akzo Nobel N.V. $11.837 $18,972 $2.311 4.585 BASF SE $66,702 $95,482 $15,205 16,972 PPG industries $12,893 $14,885 $2,141 3,682 Sherwin-Williams $9.263 $8,766 $956 993 Valspar $3.637 $3,953 $5131,057 Data Source: Financial data are from Capital IQ, stock price performance is based on CRSP data. 20x 1.1x 1.7x -5.49 -21.0% -12.8% -0.75 6.6% 13.0% 30.0% 40.4% 41.0% 1.0X 2.1x CASE 50 DuPont Corporation: ale of Performance Coatings ed Credit Suissess was up for sale after or sale after reports had surfaced that the Perfomchancek porr salean Sion A in January 2012. Ellen Kullman CEO and chairman of DuPont, was reviewing an nal report on the company's Performance Coatings division the company's Performance Coatines division. A month carlier. She had dismissed rumors that the business was un for sale after recorts had surfaced company had hired Credit Suisse potential buvers for it. Kullman stated that the business would be given a chance to see if it could meet certain performance are saying from a performance standen we will pive them a chance to see if they can get there. If any of our business Can't lain their targets, obviously we will look at alternatives for several years the business which produced paint for the auto ang trucking industries, had single with a demand and high raw material costs that had hurt profits. During her tenure as CEO, Kullman had attempted to move DuPont away from commodity chemicals to a specialty chemical and science-focused products busi ness. It was no longer clear whether DuPont Performance Coatings (DPC) fit her strate gic vision for the firm. Still, the issue was what course would produce the greatest value for shareholders. She had called for an internal review of the business that fall to assess its value to DuPont compared to what outside parties might pay for it. Those reports were now complete, and she would have to decide whether to retain the business or sell it and, if so, at what price, History of DuPont E. I. du Pont de Nemours and Company was one of the longest continually operating companies in the United States. It traced its origin to a French migr, Eleuthere Irne (E.I.) du Pont, who had studied chemistry and who, at age 14, had written a paper on Stefan Baumgarten, "DuPont CEO Slams News Media Over Reports of Coatings Business Sale." ICIS News, December 13, 2011 This case was prepared by Susan Chaplinsky, Tipton P Snavely Professor of Business Administration, and Felicia Marston, Professor of Commerce, McIntire School of Commerce, with the assistance of Brett Merker, Research Assistant. It was written as a basis for class discussion rather than to illustrate an effective or ineffective handling of an administrative situation. Copyright 2014 by the University of Virginia Darden School Foundation, Charlottesville, VA. All rights reserved. To order copies, send an e-mail to sales@dardenbusinesspublishing.com. No part of this publication may be reproduced, stored in a retrieval system, used in a spreadsheet, or transmitted in any form or by any means-electronic, mechanical, photo copying, recording, or otherwise-without the permission of the Darden School Foundation, 657 Part Fight Valuing the Enterprise Acquisitions and you gunpowder. In 1799, his family fled revolutionary France, and in 1802, he founded company in Delaware, at the urging of Thomas Jefferson to manufacturer gunpowder From its origins in gunpowder, in the 1880s, the company pioneered the manufacturer dynamite. At the turn of the 20th century, the chemistry of nitrocellulose, critical explosives, began to spawn early innovations in plastics, lacquers, films, and fiber in 1911. the US government, citing antitrust reasons, forced DuPont to break up its mo- nopoly gunpowder business. Notwithstanding this, the company made enormous profits during World War I, which it used to diversify into other businesses. By 2011. DuPont was among the world's largest chemical companies; it had $38 billion in sales and op- erations in 90 countries. Among its most well-known products were nylon introduced in 1935). Tyvek (used in construction). Kevlar (a protection product), and Teflon (a protective surface). Exhibit 50.1 shows the evolving nature of DuPont's businesses since its founding. Kullman's Watch Kullman joined DuPont in 1988 as a marketing manager after starting her career at GE. Within DuPont, she had a reputation for making businesses grow, a legacy she attributed to her father, who was a landscaper. In 1998, she launched a safety con- sulting business, which later became the Safety & Protection business, which boasted sales approaching $4 billion in 2011. She was named DuPont's CEO in January 2009 and, later that same year, chairman. That year was a difficult one for the company because its performance was closely tied to the broader economy. which had fallen into a recession. Shortly after her appointment as CEO in February 2009. DuPont's stock price fell below $19, a multiyear low Exhibit 50.2). In re- sponse to the downturn, Kullman cut costs, laid off 4.500 employees, and continued to transition the company from a commodity chemical business to a specialty chem- ical and science-driven business. Commodity chemicals typically were cyclical, and intense priced-based competition kept margins low. By moving toward spe- cialty chemicals and more customized products based on DuPont's research and development (R&D), Kullman hoped to focus the company on higher-growth and -margin businesses. As part of this plan, the company acquired Danisco, a leading food ingredient and enzyme company, for $7.1 billion in January 2011. It was the second largest acqui- sition in company history, smaller only than the 1999 acquisition of Pioneer Hi-Bred nternational, a maker of genetically modified seeds. With the shift taking place away From the "Old DuPont" to a more specialty-focused company, the drivers of growth ver the next few years were likely to be Agriculture, Nutrition & Health, Performance Chemicals, and the nascent Industrial Biosciences businesses. Kullman saw the firm's u Pont's gunpowder company was capitalized at $36.000, with 18 shares worth $2,000 each, a portion of ich was used to purchase a site on Brandywine Creek for $6,740. Jefferson advised du Pont of the new Hon's need for gunpowder and gave him his first order, calling the agreement between the two a "hand- ke that built a country," from E.I. du Pont de Nemours and Company. "DuPont-200 Years of Service ne U.S. Government in Times of Need." Case) Du future increasing r ing her to come 59 increasingly at the core of industrial biotechnology the wy was post w ete in agriculture, nutrition, and wvanced materials. She articulated her dire and for the firm in the 2010 annual report We have a ctive growth opportunities supported by the science and fucked by clobal megatrends associated with population growth We are allo TCVTCe 10 an the highest growth opportunities ... Global population will the Million war's in 20 and exceed 9 billion people by 205)-or about 1 ) oreople on the planet every day. This will translate into critical needs in the areas of feeling the world, reducing out dependence on fossil fuels and keeping people and the em fe-the megatrends that are driving our science and innovation wth opportunities culation growth. We are driven science a fossil fuels and cal needs in the With her push to match the company's focus to these megatrends, DuPont's bus -55 units were evaluated to determine whether they fit this vision and could meet the company's performance goals. The company had publicly stated that its longer-term erformance goals were to achieve 7% sales growth anwally and 12 earning margins The firm had eight separate business units: Agriculture (24% of 2011 sales). Perfor- uance Chemicals (21%). Performance Materials (18%). Performance Coatings (11%), Safety & Protection (10%). Electronics & Communications (8%). Nutrition & Health (6%), and Industrial Biosciences (2%). Based on 2011 revenue, Agriculture had grown to be DuPont's largest business Exhibit 50.3). Although there was some unevenness in rowth over the past two years, most of DuPont's divisions had been able to grow sales in line with the 7% goal. This was also true of DPC, which, in rebounding from the lows of 2009, had grown sales by 12.5% in 2011, but the growth rate in sales over the next two years was expected to be only 3% to 5% (Exhibit 50.4). More concerning was that its profit margins were the lowest among the eight businesses. All of this suggested that DPC would have to significantly improve its growth and profitability to meet DuPont's Is (21 paraleleve recomand they ction Go Perrosiness les growd Public performance goals. Performance Coatings DPC was formed in March 1999 when Herberts GmbH and DuPont Automotive Finishes merged." Its products included high-performance liquid and powder coatings for motor vehicle original equipment manufacturers (OEMs), the motor vehicle after- market (refinishing), and general industrial applications, such as coatings for heavy equipment, pipes and appliances, and electrical insulation. DPC employees liked to say that the products they made didn't make cars go faster, they just made them look good going faster. From 2007 to 2011, sales had grown at a-0.3% cumulative average growth rate (CAGR) and profits had declined at a 6.0% CAGR (Exhibit 50.5). Due to the DuPont, "Letter to Shareholders," 2010 Annual Review, 2011, 2. *DuPont had been a supplier of paint to the U.S. auto industry since its infancy, providing paint to General Motors in the 1920s. Herberts, a subsidiary of Hoechst, was acquired for $1.9 billion, making the combined firms the largest supplier of automotive finishes in the world. At the time, 80% of Herberts's operations were in Europe, while 75% of DuPont's business was in North America. Sales to OEMs included all vehicles (e.g., cars, trucks, buses, and motorcycles). aged cars that w ("totaled) and in cars more frequen mated 7 of dan lated to 80.000 the quality of pai weathering Also reducing the demand for paint was Sinificant d it the number of dam eurs that were refinished. This was due to more damaged as being written wled) and msurance companies imposine bicher deductibles such that damage more frequently went without repair in the United Kingdom for example, 74 of damaged cars were written of in 2016 and in 2 that trans to 80.000 fewer cars requiring repair and it cry year. Further, wvances quality of paint used by OEMs made it more durable and resistant to scratches and production in American vehicle units). Overton (13.5 min to recov The OEM market had experienced a sharp decline in global motor vehicle duction in 2009 that had since begun to recover Exhibit 50.8) In 2011. Non merican vehicle production (13.5 million units) still fall host of its 2007 love 155 million units). Over the past decade, most of the growth in vehicle produc- an had taken place in countries outside the United States, particularly in emers markets. For example, between 2000 and 2010, China and India had experienced astonishing 7636 and 344% increase, respectively in vehicle manufacturing DP'S existing customer base was heavily concentrated in Detroit, but North merica accounted lor only 27% of its revenues. As vehicle manufacturing contin od to grow outside North America, DPC's revenues would likely expand in those an astonishing 7630 6 and 344 en 2000 and 2nited State omer base increase re2010. China es particul markets. PPC's overall revenues were closely tied to GDP growth, which was expected he 1% to 2% in 2012-13 in the United States, largely flat in Europe, and more nositive but erratic in emerging markets. Most analysts expected that emerging- market growth coupled with unprecedented fleet aging would spur a recovery in vehicle sales on the order of 3% to 5% per year. Increases in sales, however, did not necessarily translate into higher profits for several reasons. First, the OEM profit margins were set by multiyear contracts with vehicle manufacturers, which made it difficult for paint suppliers to quickly pass on raw material price increases. By com- parison, the margins in refinishing were primarily based on claims paid by insurance companies, which left consumers less price sensitive to repair costs. Second, grow- ing concerns about lead, the high cost of treating airborne emissions and solid haz- ardous waste generated by paint operations, and new regulations covering the global chemical industry in Europe were all expected to increase environmental compliance costs gradually over time. Although a bullish scenario could be concocted for DPC, industry trends suggested that stable to modest improvement was the more likely course for the business over the next several years. As part of the internal review, DuPont attempted to assess DPC'S value if it remained a division of the company. DuPont's internal targets for DPC were annual revenue growth of 3% to 5% and operating margins of 10% to 12%. Given DPC'S mixed track record of performance, the internal review set targets at 4% for growth and 10% for margins, the low end of the targeted range. Other assumptions underlying the stand-alone valuation were incorporated into the analysis itself (Exhibit 50.9) and Together yielded a value of approximately $4 billion for the division. Morgan Stanley. "E. I. du Pont de Nemours & Co.," analyst report, February 13, 2012 Morgan Stanley, 5. Putihi Valine the Inter Acquisitions and Buy company's exposure to the auto sector, sales and earnings had been adversely affected by the 2008 and 2009 downturn. In 2011, the company posted stronger revenue growth of 12.5, but most of this was attributed to price increases, which were unlikely to con tinue. Notwithstanding the pickup in sales, operating margins remained muted because of rising input costs. Nearly 50% of the key raw material inputs (eg.. hydrocarbon sol vents and organic pigments) were tied to crude oil prices, which had risen since the middle of 2010 due to tight supply and improving economic conditions. Key competitive factors in its business included technology and technical exper- tise, product innovation and quality, breadth of product line, service, and price. In most industrial applications, the coating itself was only a small part of total production costs (e... 10% to 15%). and most customers were willing to pay more for technologically advanced coatings if it reduced application costs (eg.. labor). The industry in general was also not highly capital-intensive-capital expenditures and R&D were relatively small in comparison to the variable costs of production DPC held the number-four position in the global industrial coatings market, where it faced strong competition in all the business verticals that made up the industry (Exhibit 50.6). The market was highly fragmented: two companies-PPG Industries and Akzo Nobel N.V., each with sales greater than $10 billion-together accounted for 25% of industry sales. Seventeen firms had sales between $1 billion and S10 billion, the range of DPC's sales, which accounted for 45% of sales. The remainder of sales came from over 60 additional firms. Given the increased pressures for cutting costs and find ing higher-growth opportunities, over the last six years, the industry had been consoli- dating: the market share of the six top companies increased from 28% in 2005 to 35% in 2011. The top-10 global competitors controlled 60% to 75% of the sales in U.S. and European markets. To varying degrees, all the top competitors saw opportunities for growth in the less saturated Asia-Pacific and Latin American markets. Relative to peers. DPC's strengths were in refinishing and the vehicle OEM mar- ket. In 2011, the vehicle aftermarket accounted for 43% of the division's sales, down from 53% of sales in 2009. The decline in refinishing was of concern because its profit margins tended to be higher than those in the vehicle OEM market. Or the $7 billion global refinishing market, PPG and DuPont were the market leaders-cach had ap- proximately a 28% market share-followed by Akzo Nobel (17% market share). Sales to motor vehicle OEMs accounted for 37% of DPC's 2011 sales, and DPC held the number-three market position in the OEM paint market behind PPG and BASF SE. The two key drivers of revenue for these businesses were miles driven and vehi- cle sales. Miles driven was correlated with the incidence of collisions, which affected the demand for paint from refinishing, and sales of vehicles generated demand for paint from OEMs (Exhibit 50.7). Trends in the refinishing market were generally steady to negative. In the past several years, the number of miles driven in the United States had tapered off, resulting in fewer collisions. Potentially offsetting this trend was an expected increase in miles driven-and relatedly, collisions-outside the United States. Buckingham Research Group, PPG Industries: "Other" Industrial Coatings Review, May 21, 2012. 2 Partit Vahing the wri t ions and Blue Potential Buyer's When news surfaced in late October 2011 that DuPont was seeking a potential bu DPC, companies including PPG BASE Ako Nobel, and Valspar Corporation mentioned as prospective strategie buyers. For all but BASF, a potential purchase of billion would be a sizable transaction to complete Exhibit 50.10). In respons question about his county's extential interest. Valspar CEO Gary E. Hendrickson that DPC was a little biebsite for us. Although the $4 billion price tag would De large in the current environment for private equity (PE) firms, Blackstone, Adva International, KKR Co One Corporation, and Clayton. Dubilier & Rice were reportedly considerine bids or had already made inquiries about the division. The inter est from PE firms was not surprisine given that buyout firms were sitting on levels of "dry pwder cumulatively totaling over $400 billion at the end of 2011 large portion of that was concentrated in buyout funds with 2000 and 2007 vintage year In those years, buvau funds had raised record amounts of capital but had found it diff cult to invest in the ensuine crisis vers. As these funds neared the end of their investe periods, their general partners were under increasing pressure to find investments A leveraged buyout (LRO) was the purchase of a firm facilitated by large amount of debt financing. In an LBO, the PE firm or sponsor would arrange debt financing for the deal and contribute the balance of financing with equity from one or more of its funds. Because of the anticipated higher debt load, PE firms generally looked for firms that could readily service the debt. Target characteristics might include steady and pre- dictable cash flows, assets that provided good collateral for debt, or non-core assets that could be sold to pay down debt. Debt support and returns) could also be bolstered if the targets had opportunities to grow EBITDA by increasing sales or cutting costs. For similar reasons, sponsors looked for mature firms that did not seemingly require large amounts of additional capital expenditures or R&D. Most sponsors also looked for a strong management team because they typically were not hands-on operators and had to rely on the target's management to run day-to-day operations. Of course, to make a good return, the sponsor had to increase the target's value above its purchase price over a typically four to five-year period, after which it would seek to exit the investment. Sponsors in PE deals generally looked to three factors to drive returns in their investee companies: benefits from the use of leverage, growth in EBITDA, and multiple arbitrage (i.e., buy at a low multiple and sell at a high multiple). Benefits of Leverage One benefit of leverage was that interest on debt was tax deductible and therefore the cost of debt was lower than the cost of equity. As a result, increasing leverage could produce interest tax shields that enhanced the company's value. The use of leverage Doug Cameron, "Valspar: DuPont Coatings Business Too Big a Bite for Us to Buy." Wall Street Journal, May 14, 2012 At the same time, DuPont hired Greenhill & Co. to handle the sale of a smaller part of the business that handled coatings for tractors and playground equipment. Zachary R. Mider and Jeffrey McCracken "DuPont Is Said to Weigh $4 Billion Sale of Auto-Paint Unit," Bloomberg. October 28, 2011. Partit Valuing the Enterprise: Acquisitions and Buyouts DPC was led by DuPont veteran John McCool, 58, who was well regarded in the industry. MeCool had held a variety of leadership positions since joining DuPont Textile Fibers department in 1976. Kullman named McCool president in 2010 after he had served as vice president for DPC's Europe, Middle East, and Africa (EMEA) op erations. She had given him the specific charge to turn the division's performance around. All the PE firms that were contemplating a bid for DPC would have to evaluate McCool and his team to see if they had the requisite skills to head the new company the current team was found wanting, the sponsors would have to be prepared to replace management as part of their plans. Multiple Arbitrage Multiple arbitrage arose when a sponsor received a higher PPM at exit for a larger than it paid for it. All else equal, the higher the entry PPM, the lower the chances of a spon- sor achieving multiple arbitrage. At a stand-alone value of approximately $4 billion, it looked as if DPC's potential buyers would have to pay on the order of 7x projected EBITDA for the company. Exit opportunities could arise from an IPO, sale to a strate. gic buyer, or sale to another PE fund (secondary buyout). Over the period 2006 to 2011. sales to strategic buyers had been the most frequent mode of exit by PE firms (Exhibit 50.12). Due to the growth in the size of the PE sector, however, secondary buyouts were a strong second to them. IPOs had fallen off as exit vehicles, in part due to uncertain market conditions accompanying the financial crisis and its aftermath. Because strategic buyers likely had greater opportunity for operating synergies with a target company, they were commonly thought to pay more for a target than financial buyers. Based on the PPMs of recent exits, however, the average PPM for exits to see- ondary buyouts was somewhat higher than the average PPM of exits to strategic buyers (Exhibit 50.12). Based on the current valuation of PPG and potential market expan- sion, sponsors might look to achieve 7.5x to 8.0X EBITDA at exit for DPC, given improvements in margins and growth as a private firm. Decision If Ellen Kullman decided to divest DPC, she would put in motion an auction for the division. At that point, DuPont would provide detailed information about the target and invite interested parties to bid. As part of that process, she would likely set a minimum price for bidders. Her stand-alone valuation suggested that the division was worth nearly $4 billion to DuPont. She would then need to assess how much potential additional value could be obtained, both separately and jointly, from EBITDA growth, multiple arbitrage, and the use of leverage to give her some idea of the potential range of values that bidders might offer. Relative to that, she knew that sponsors would likely seek higher returns to justify the greater financial risk from the use of leverage. Although financial buyers naturally sought the highest possible internal rate of return (IRR), in the current environment of tough competition, they often had to settle for IRRs of 20%. With that in mind, she would formulate her minimum required bid to ensure that share- lolders' interests were served no matter what decision she reached about DPC. Businessment Performance (dois in Cette partie en ENNT BO ons and communications 2009 $7. 00 2010 1.918 1.218 $7,345 2.764 2011 16 3,123 and health c ance chemicals romance coatings romance materials y and protection trial biosciences 4.964 2.429 4,768 2,811 1.240 5.322 3.805 5.27 3364 Year 2009 7800 -1076 -13.2 -145 -21.45 253 - 2942 Year Growth 2010 2011 11.00 15.000 44 18 14.8% 1.8 98.4% 2745 23 11.04 12 .5% 319 B4% 197% 16.96 5,815 3,934 Tot segment Sales misation of transfers - 156 705 26 335 Net ses 1226) 126 109 31.822 (317) $31.505 38.368 407 $37.961 -14 % 207% - Operating Income. 20.5% Segment Margins Agriculture 2009 $1,160 2011 monics and communications 2010 $1.293 2009 445 $1527 355 62 Nutrition and health performance chemicals Performance coatings performance materials Sally and protection dustrial biosciences 1.081 547 69 287 260 1.923 274 973 500 249 994 454 2010 2011 65% 15.7% 16.1% 11.2% 5.0% 1.8% 17.1% 24.7% 65% 6.3% 15.8% 14.3% 13.5% 12.7% 16.4% 45% 5.3% 11.09 20% 60% 92% Camaceuticals (discontinued 1,037 (169) -0.1% 489 1206) 289 al pretax operating income $3,342 1235) $4,861 $5.646 12.8% 15,4% 14.9% significant items Surse: Company reports Performance Coatings Historical Performance doors in millions) DuPont C Copa owo Sale of EXHIBIT 50.5 Sule of Performance Coin Net sales 2007 $4.347 2008 $4.360 0.3% ar-over-year growth operating income 2010 5 year 2011 366 2009 $3.42 21.4% 59 2.05 argin -0.3% preciation and amortization search and development $3,806 110% 255 573 $4281 12.5% 268 6.3 -60% 107 71 126 2.607 123 capital expenditures Segment net assets 105 56 104 69 91 2.226 55 46 74 2,018 Sales by industry Amermarket (refinishing 2.047 BO 2.102 Vehicle OEM General industrial 44% 43% Other 37% 14% 15% 59 Sales by region North America Asia-Pacific 266 12% 27% Europe, Middle East and Africa Latin America 46% 27% 13% 43% 13% 44% 16% Source: Company Databooks, various years. 189 179 Global $40,9 Refinishing 100% Auto OEM $124 Packaging EXHIBIT 50.6 | Global Competitive Position in Industrial Coatings Market Protective Position Architectural Industrial and Marine End market sales (billions) $95.0 $24.7 % of end market sales 43% 26% 13% Peer ranking: Akzo Nobel PPG Sherwin-Williams $6.7 Aerospace $5.7 6% $2.9 519 N- DuPont Valspar BASF A blank cell indicates "no participation in business vertical, Penetration Rates of Top Global Competitors by Region Percent of Sales of Top-10 Competitors 75% U.S. and Canada EME Pecc Latin America 60% 30% 30% Data Source: Buckingham Research Group, PPG Industries: "Other" industrial Coatings Review, May 21, 2012. EXHIBIT 50.9 Stand Alone Valuation dollars in millions) PPG Industries Metric Sales growth (%) EBIT margin (Pretax) EV/EBITDA 2012(X) Actual 2011 10.9% 11.2% Projected 2012E 2013E 4.1% 43% 11.0% 120% 7.3 DuPont Performance Coatings Closing 2012 Projected 2014 2015 2016 2011A 12.5% $104 6.3% 25% 4.0% $125 2013 4.0% $118 10.0% 25% $122 15.0% Metric Sales growth (%) Depreciation and amortization EBIT margin (Pretax) Tax rate' Capital expenditures Net working capital (%) Terminal EBITDA multiplex Debt/EBITDA 2012 (X) Debt Blended interest rate on debt Unlevered cost of equity $115 10.0% 25% $115 15.0% 100% 4.0% $122 10.0% 25% $132 15.0% $80 $120 1005 255 $150 150% 70 $144 15.0% N/A 6.75% 11.2% EXHIBIT 50.9 1 Stand Alone Valuation continued) 2011A $4,281 $372 $104 $268 APV Analysis Closing 2012 $4,452 $560 2013E $115 $445 $0 $445 Net Sales EBITDA Depreciation and amortization Pretax operating income (EBIT) Interest expense Earnings before taxes Taxes Net income Increase in net working capital Capital expenditures Residual (levered) cash flow Unlevered free cash flow (FCF) Terminal value Unlevered FCF, including TV Enterprise value (EV) Interest tax shield PV tax shield EV with tax shield $4,630 $581 $118 $463 __$0 $463 $116 $347 ($271 ($122 $317 $317 2014 $4,816 $604 5122 $482 $0 $482 $120 $361 ($281 $132) $323 $323 2015E $5,000 $626 $125 $501 $0 $501 $125 $376 ($29 $144 $327 $334 1926) ($115) $308 $308 2016 $5.208 $651 $130 $521 $0 $521 $130 $391 $30 $150 $341 $341 $4.738 $5,079 $327 $308 $317 $323 $327 $3,970 $3,970 January 2012. PPG's projections are based on Bucaram Data Sources: Historical information for DPC is from DuPont company Datebooks Projections are case writer estimates. PPG's enterprise value is based on prices at the end of search Group analyst report, PPG industries 'Omer industrial Coatings Review, May 21, 2012. Notes to stand-alone model TDPC's estimated average tax rate of 25% is lower than the marginal corporate tax rate as a result of international operations exed at lower rates 2Assumed forward exit multiple for Terminal value is based on projected EBITDA growth in 2017 and is below PPS's multiple because of lower margins and slightly lower growth Unlevered Cost of Equity (k) is based on PPG's estimated unlevered beta of 1.2, a nomazed 4% long term U.S. Treasury rate and a 5% markers premium EXHIBIT 50.10 | Financial Characteristics of Potential Strategic Buyers (fiscal-year-end values in millions, except multiples and percentages) Total Debt EBITDA 5-Year Stock Performance -Year Stock Performance NA Market Capitalization 12/31/2011 Revenues EBITDA Total Debt Akzo Nobel N.V. $11.837 $18,972 $2.311 4.585 BASF SE $66,702 $95,482 $15,205 16,972 PPG industries $12,893 $14,885 $2,141 3,682 Sherwin-Williams $9.263 $8,766 $956 993 Valspar $3.637 $3,953 $5131,057 Data Source: Financial data are from Capital IQ, stock price performance is based on CRSP data. 20x 1.1x 1.7x -5.49 -21.0% -12.8% -0.75 6.6% 13.0% 30.0% 40.4% 41.0% 1.0X 2.1xStep by Step Solution
There are 3 Steps involved in it
Step: 1

Get Instant Access to Expert-Tailored Solutions
See step-by-step solutions with expert insights and AI powered tools for academic success
Step: 2

Step: 3

Ace Your Homework with AI
Get the answers you need in no time with our AI-driven, step-by-step assistance
Get Started


