Answered step by step
Verified Expert Solution
Question
1 Approved Answer
*** in java *** no video is needed line1.txt line2.txt line3.txt line4.txt line5.txt Administrative: 1. Put your information (name, class, etc) in a header comment
*** in java *** 


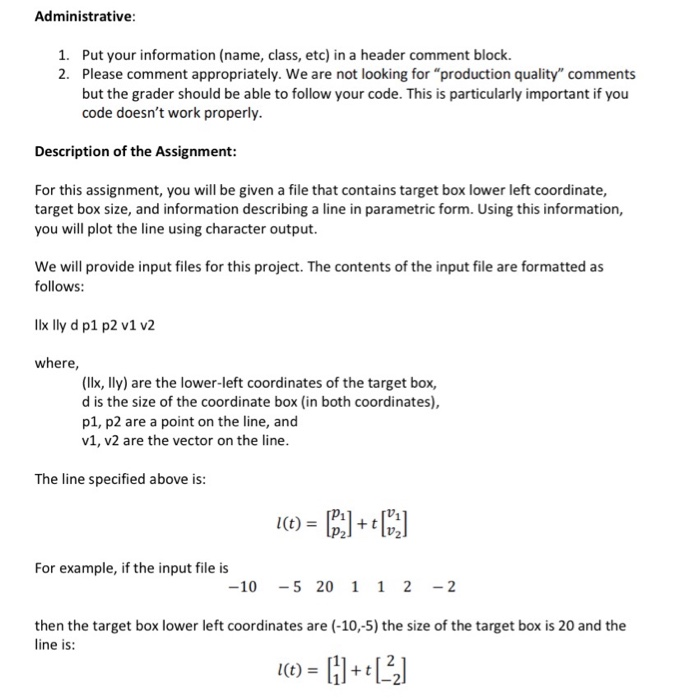
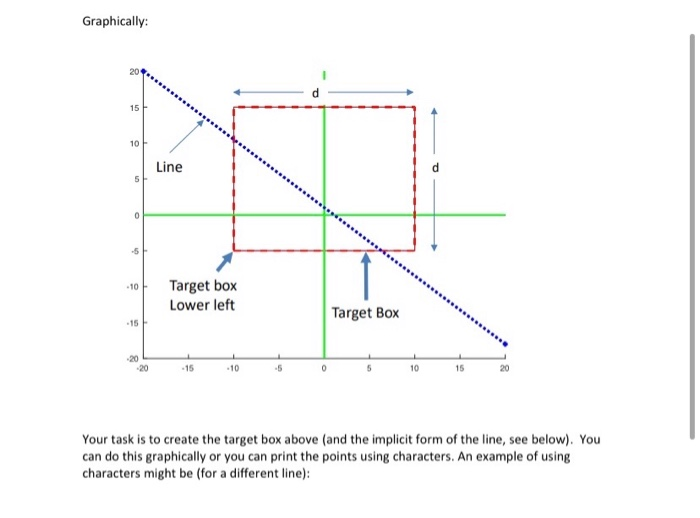
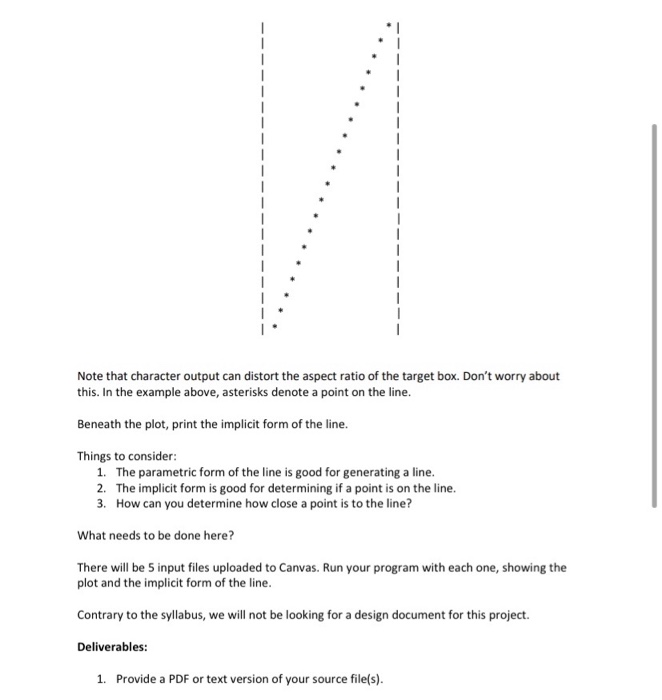
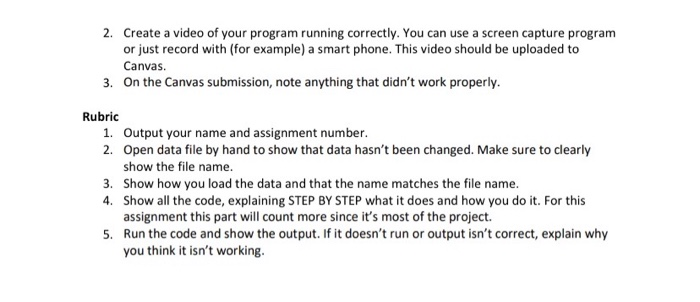
Administrative: 1. Put your information (name, class, etc) in a header comment block. 2. Please comment appropriately. We are not looking for "production quality" comments but the grader should be able to follow your code. This is particularly important if you code doesn't work properly. Description of the Assignment: For this assignment, you will be given a file that contains target box lower left coordinate, target box size, and information describing a line in parametric form. Using this information, you will plot the line using character output. We will provide input files for this project. The contents of the input file are formatted as follows: llx lly d p1 p2 v1 v2 where, (Ilx, lly) are the lower-left coordinates of the target box, d is the size of the coordinate box (in both coordinates), p1, p2 are a point on the line, and v1, v2 are the vector on the line. The line specified above is: 1(t) = (3] +Ciz] For example, if the input file is -10 -5 20 1 1 2 - 2 then the target box lower left coordinates are (-10,-5) the size of the target box is 20 and the line is: l(t) = []++[-] Graphically: ine -10 Target box Lower left Target Box - 15 10 -5 0 5 10 15 20 Your task is to create the target box above (and the implicit form of the line, see below). You can do this graphically or you can print the points using characters. An example of using characters might be (for a different line): Note that character output can distort the aspect ratio of the target box. Don't worry about this. In the example above, asterisks denote a point on the line. Beneath the plot, print the implicit form of the line. Things to consider: 1. The parametric form of the line is good for generating a line. 2. The implicit form is good for determining if a point is on the line. 3. How can you determine how close a point is to the line? What needs to be done here? There will be 5 input files uploaded to Canvas. Run your program with each one, showing the plot and the implicit form of the line. Contrary to the syllabus, we will not be looking for a design document for this project. Deliverables: 1. Provide a PDF or text version of your source file(s). 2. Create a video of your program running correctly. You can use a screen capture program or just record with (for example) a smart phone. This video should be uploaded to Canvas. 3. On the Canvas submission, note anything that didn't work properly. Rubric 1. Output your name and assignment number. 2. Open data file by hand to show that data hasn't been changed. Make sure to clearly show the file name. 3. Show how you load the data and that the name matches the file name. 4. Show all the code, explaining STEP BY STEP what it does and how you do it. For this assignment this part will count more since it's most of the project. 5. Run the code and show the output. If it doesn't run or output isn't correct, explain why you think it isn't working. | 0 0 255511 | -10 -10 20 -30 630 | 10 10 30 -11-11 14 14 | -10 10 20 -12 20 3 -1 | 05 15 05 10 1 no video is needed


line1.txt

line2.txt

line3.txt

line4.txt

line5.txt

Step by Step Solution
There are 3 Steps involved in it
Step: 1

Get Instant Access to Expert-Tailored Solutions
See step-by-step solutions with expert insights and AI powered tools for academic success
Step: 2

Step: 3

Ace Your Homework with AI
Get the answers you need in no time with our AI-driven, step-by-step assistance
Get Started


