Answered step by step
Verified Expert Solution
Question
1 Approved Answer
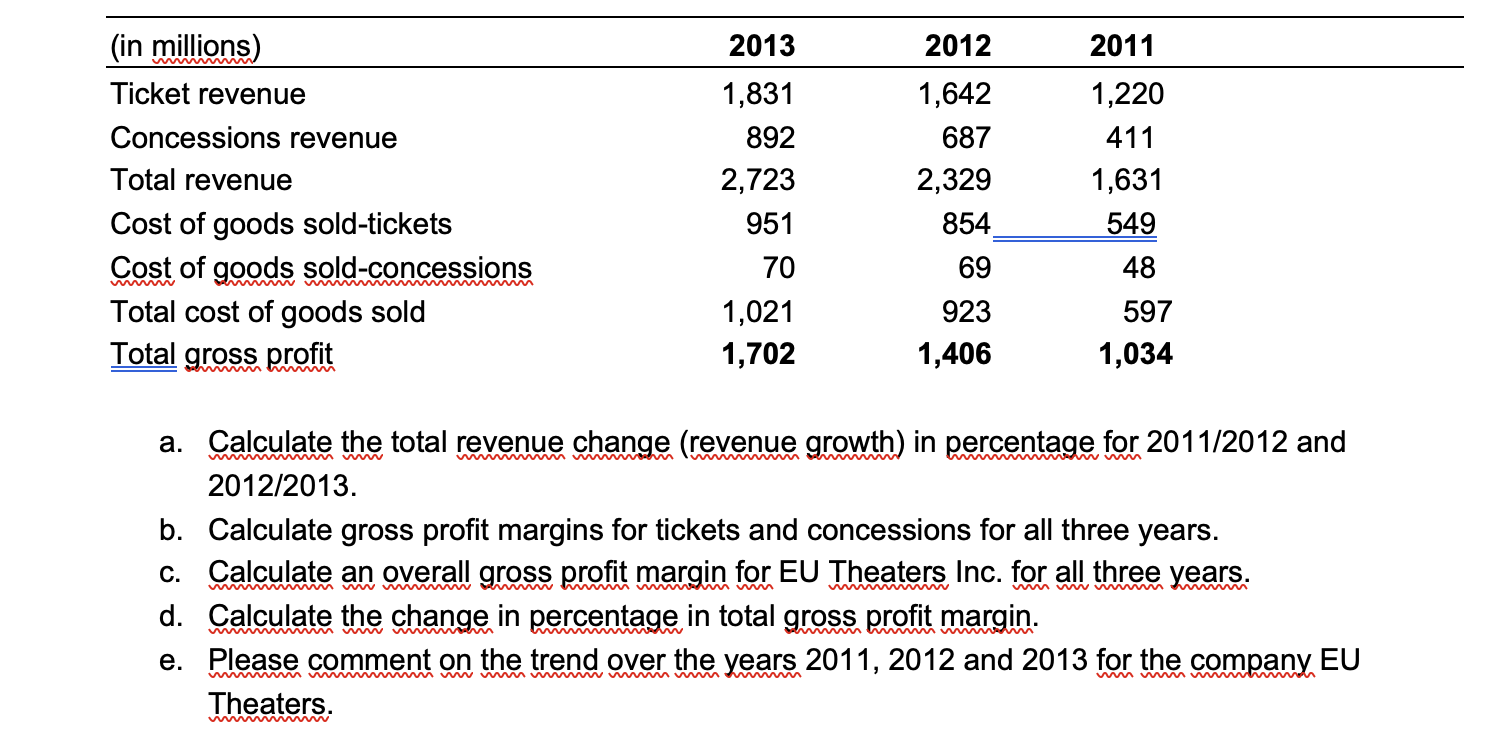
(in millions) 2013 2012 2011 Ticket revenue 1,831 1,642 1,220 Concessions revenue 892 687 411 Total revenue 2,723 2,329 1,631 Cost of goods sold-tickets

(in millions) 2013 2012 2011 Ticket revenue 1,831 1,642 1,220 Concessions revenue 892 687 411 Total revenue 2,723 2,329 1,631 Cost of goods sold-tickets 951 854. 549 Cost of goods sold-concessions Total cost of goods sold 70 69 48 1,021 923 597 Total gross profit 1,702 1,406 1,034 a. Calculate the total revenue change (revenue growth) in percentage for 2011/2012 and i mi mim m meen A w m 2012/2013. b. Calculate gross profit margins for tickets and concessions for all three years. c. Calculate an overall gross profit margin for EU Theaters Inc. for all three years. wm w w wwi d. Calculate the change in percentage in total gross profit margin. e. Please comment on the trend over the years 2011, 2012 and 2013 for the company EU Theaters.
Step by Step Solution
★★★★★
3.38 Rating (151 Votes )
There are 3 Steps involved in it
Step: 1
Solution a Revenue change for 201112 is 232916311631100 4279 Revenue change for 201213 ...
Get Instant Access to Expert-Tailored Solutions
See step-by-step solutions with expert insights and AI powered tools for academic success
Step: 2

Step: 3

Ace Your Homework with AI
Get the answers you need in no time with our AI-driven, step-by-step assistance
Get Started


