

Answered step by step
Verified Expert Solution
Question
1 Approved Answer
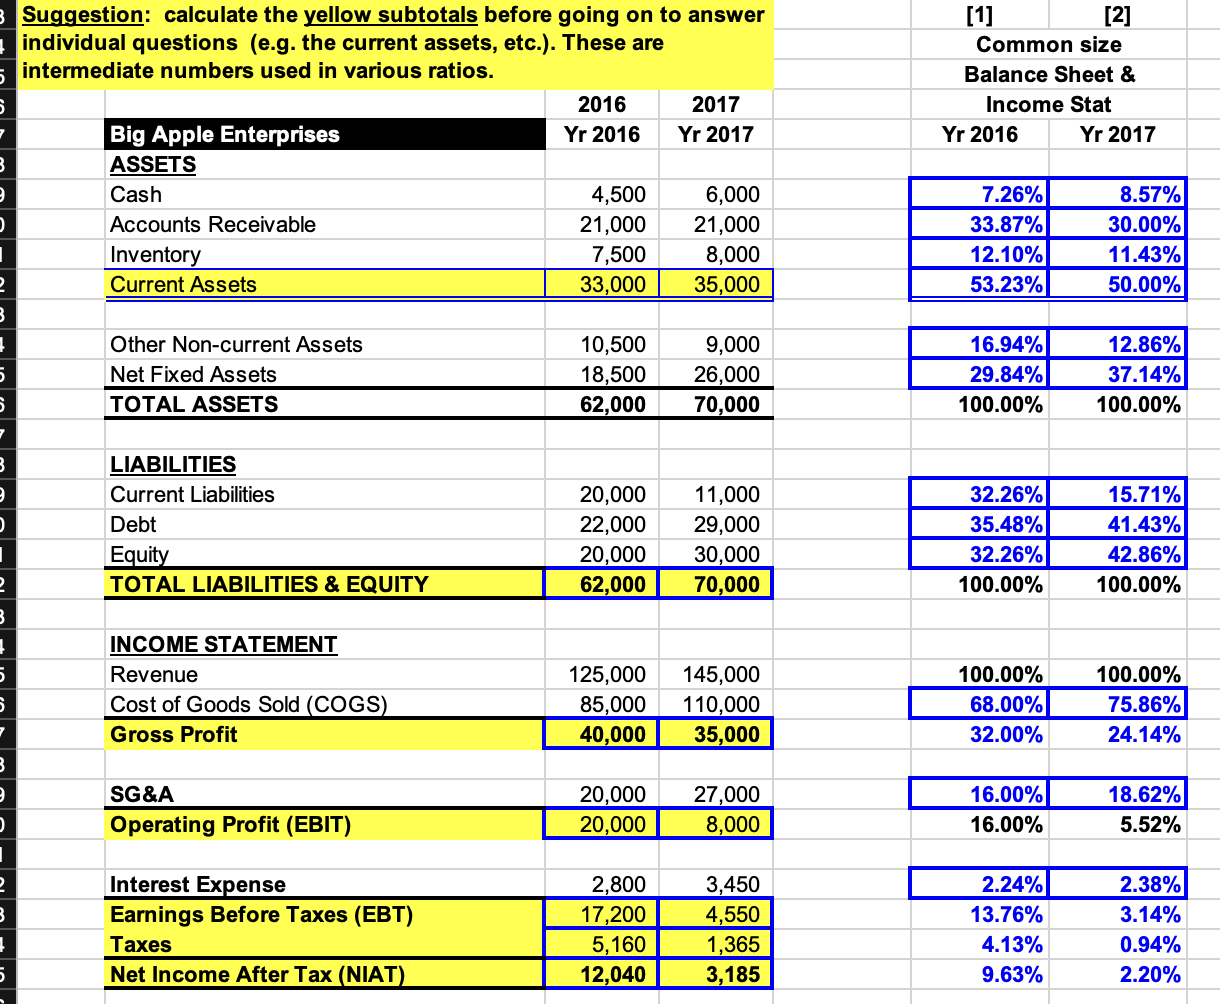
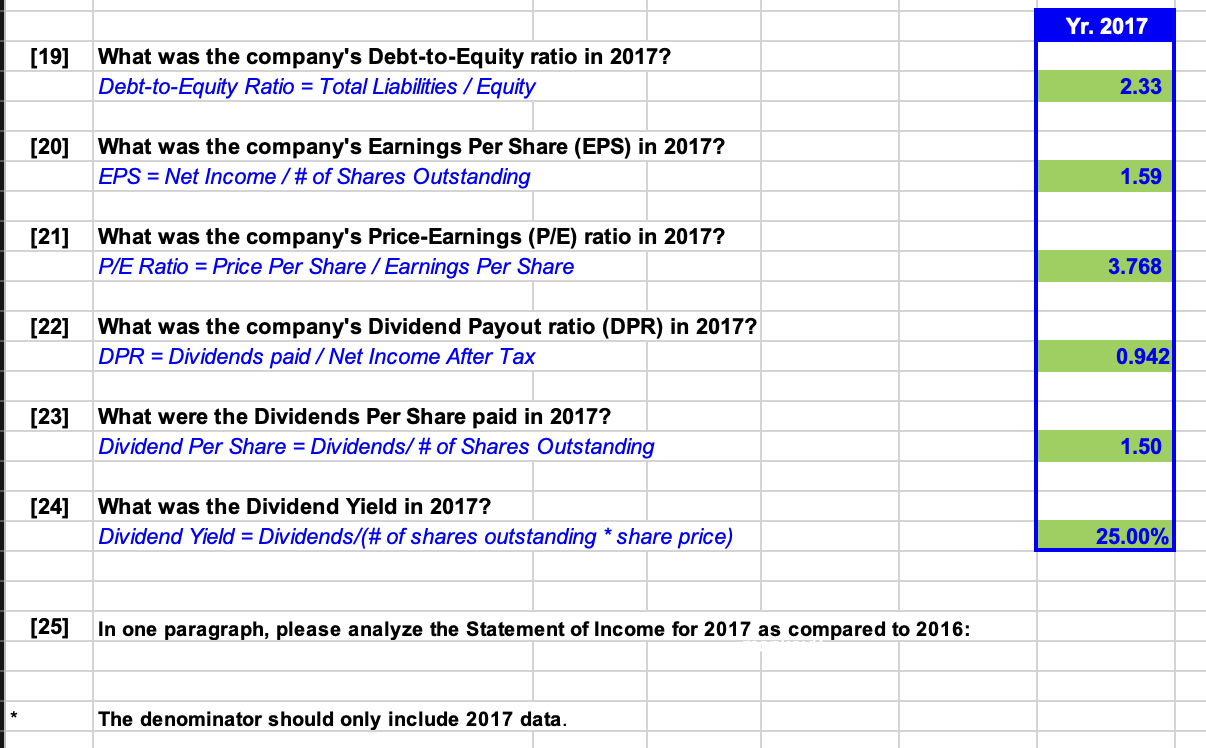
In one paragraph, please analyze the Statement of Income for 2017 as compared to 2016: The denominator should only include 2017 data. [1] [2] Common
In one paragraph, please analyze the Statement of Income for 2017 as compared to 2016:
The denominator should only include 2017 data.
Step by Step Solution
There are 3 Steps involved in it
Step: 1

Get Instant Access to Expert-Tailored Solutions
See step-by-step solutions with expert insights and AI powered tools for academic success
Step: 2

Step: 3
Ace Your Homework with AI
Get the answers you need in no time with our AI-driven, step-by-step assistance
Get Started
Handbook On Anti Money Laundering And Combating The Financing Of Terrorism For Nonbank Financial Institutions
Authors: Asian Development Bank
1st Edition
9292577611, 978-9292577612