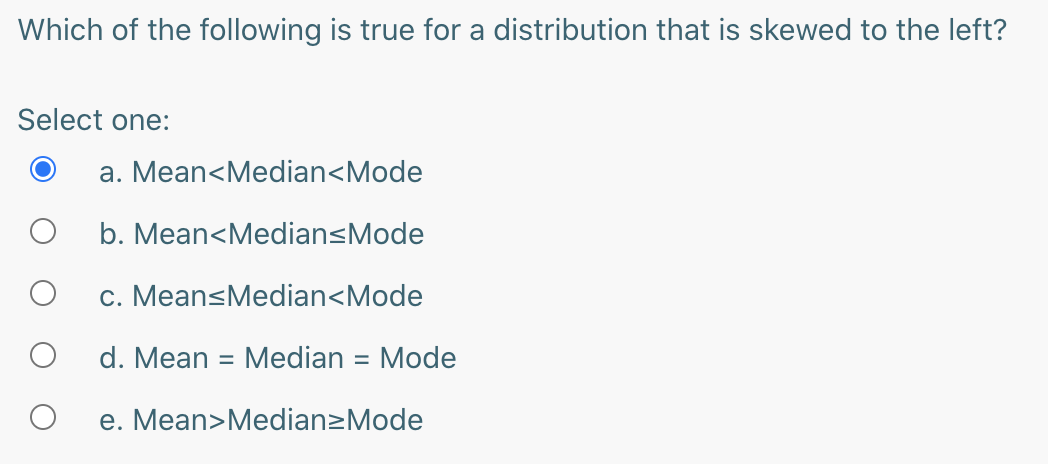
In order to estimate the average diameter of oranges grown in California, a random sample of 25 oranges were selected. The sample mean was found to be 7.5 cm with a sample standard deviation of 1.5 cm. A 90% confidence interval for the population mean is? (critical values below) t 0.05;24=1.710 t 0.025;24=2.064 t 0.1;24=1.317 t 0.01;24=2.492 z 0.05:1.644 z 0025:1959 z 0.1=1.281 Z 0.01:2.326 Select one: Q a. (6.987, 8.013) b. (5.443, 9.561) c. (6.881, 8.129) d. (5.544, 9.468) 0000 e. We don't have enough information to compute CI. Which of the following is true for a distribution that is skewed to the left? Select one: a. Mean
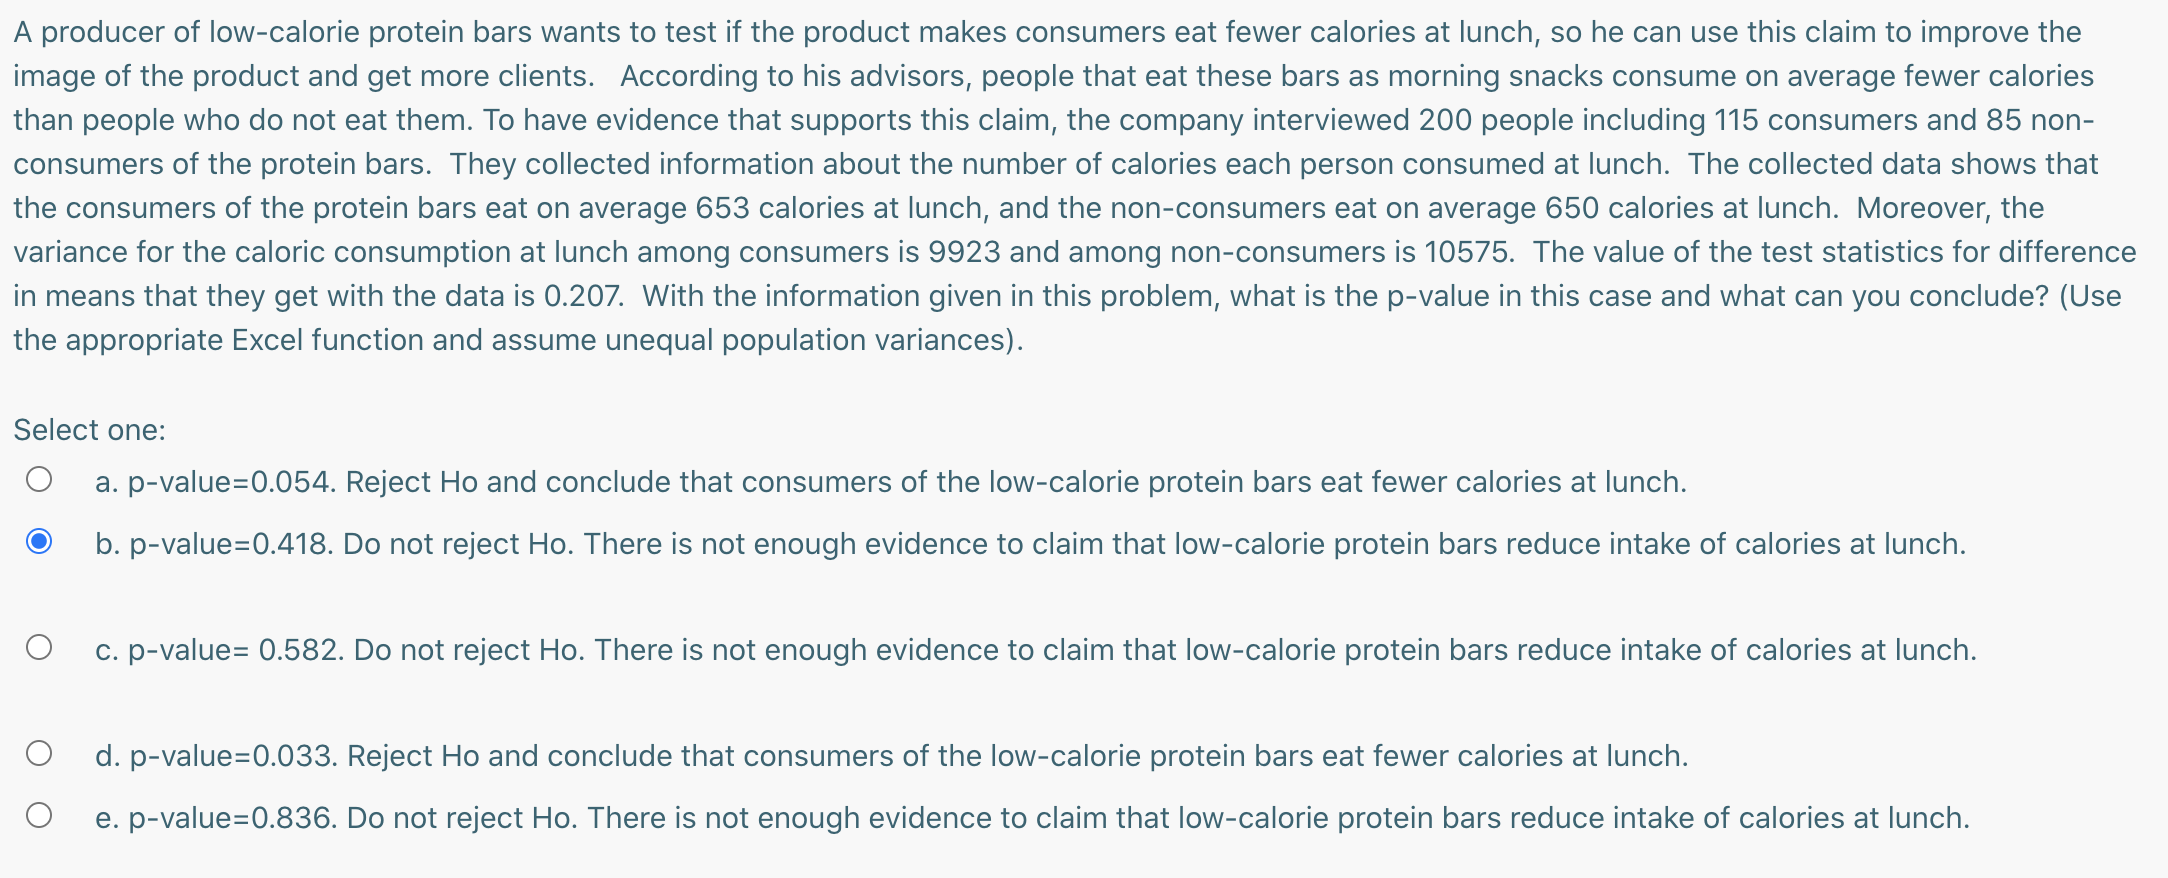
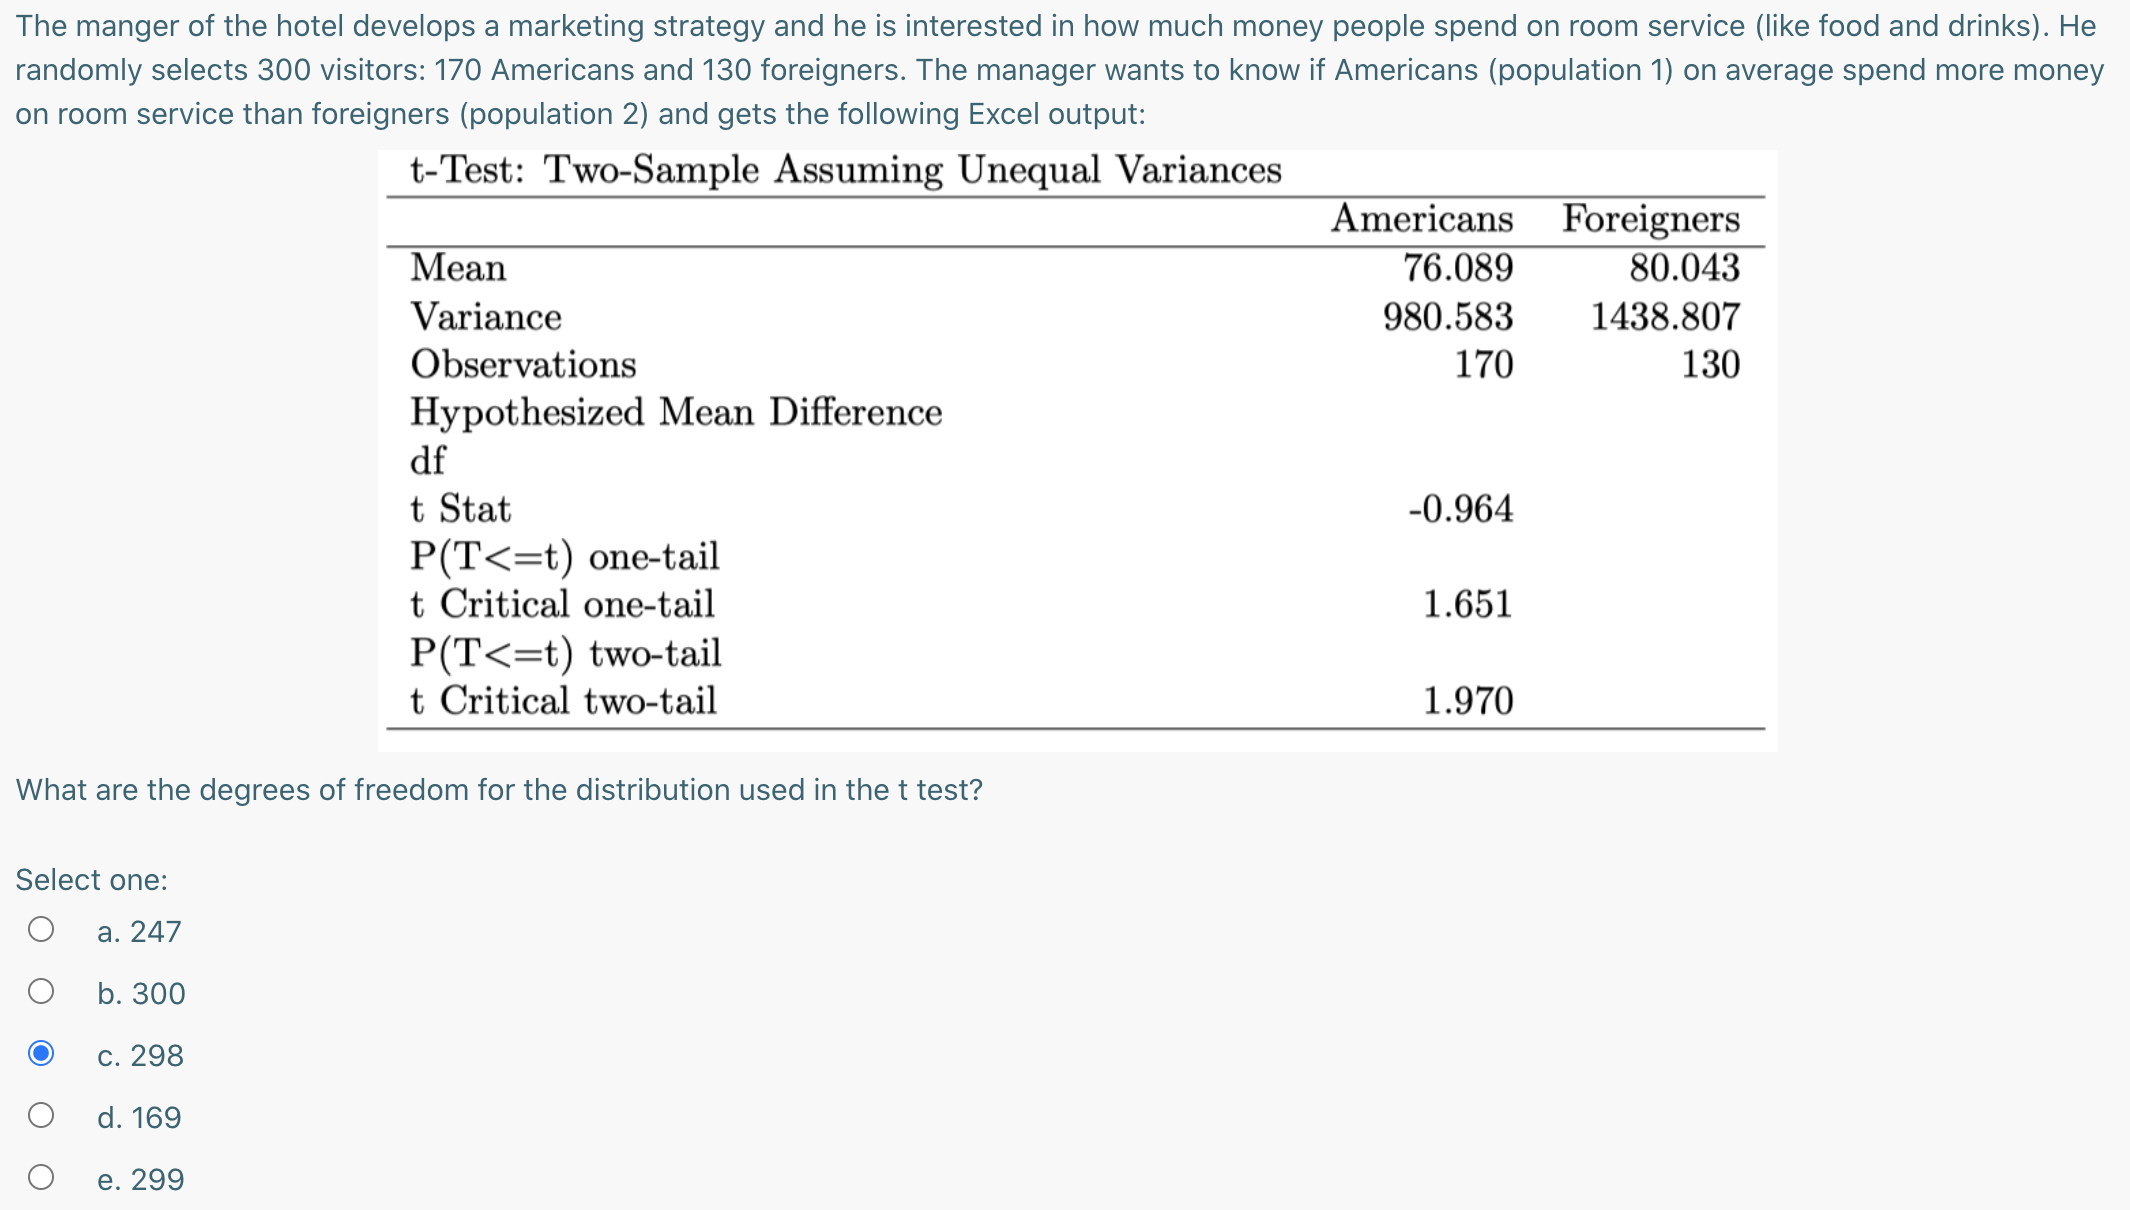
MedianzMode A producer of low-calorie protein bars wants to test if the product makes consumers eat fewer calories at lunch, so he can use this claim to improve the image of the product and get more clients. According to his advisors, people that eat these bars as morning snacks consume on average fewer calories than people who do not eat them. To have evidence that supports this claim, the company interviewed 200 people including 115 consumers and 85 non- consumers of the protein bars. They collected information about the number of calories each person consumed at lunch. The collected data shows that the consumers of the protein bars eat on average 653 calories at lunch, and the non-consumers eat on average 650 calories at lunch. Moreover, the variance for the caloric consumption at lunch among consumers is 9923 and among non-consumers is 10575. The value of the test statistics for difference in means that they get with the data is 0.207. With the information given in this problem, what is the p-value in this case and what can you conclude? (Use the appropriate Excel function and assume unequal population variances). Select one: Q a. p-value=0.054. Reject Ho and conclude that consumers of the low-calorie protein bars eat fewer calories at lunch. b. p-value=0.418. Do not reject Ho. There is not enough evidence to claim that low-calorie protein bars reduce intake of calories at lunch. 0 c. p-value: 0.582. Do not reject Ho. There is not enough evidence to claim that low-calorie protein bars reduce intake of calories at lunch. 0 d. p-value=0.033. Reject Ho and conclude that consumers of the low-calorie protein bars eat fewer calories at lunch. 0 e. p-value=0.836. Do not reject Ho. There is not enough evidence to claim that low-calorie protein bars reduce intake of calories at lunch. The manger of the hotel develops a marketing strategy and he is interested in how much money people spend on room service (like food and drinks). He randomly selects 300 visitors: 170 Americans and 130 foreigners. The manager wants to know if Americans (population 1) on average spend more money on room service than foreigners (population 2) and gets the following Excel output: t-Test: Two-Sample Assuming Unequal Variances Americans Foreigners Mean 76.089 80.043 Variance 980.583 1438.807 Observations 170 130 Hypothesized Mean Difference df t Stat -0.964 P(T


