In particular, you are to determine who is interested in your product. This means developing a profile of typical customers in reference to age, gender,
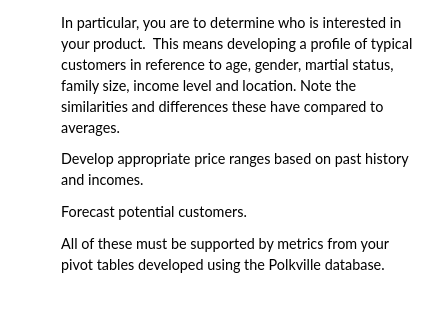
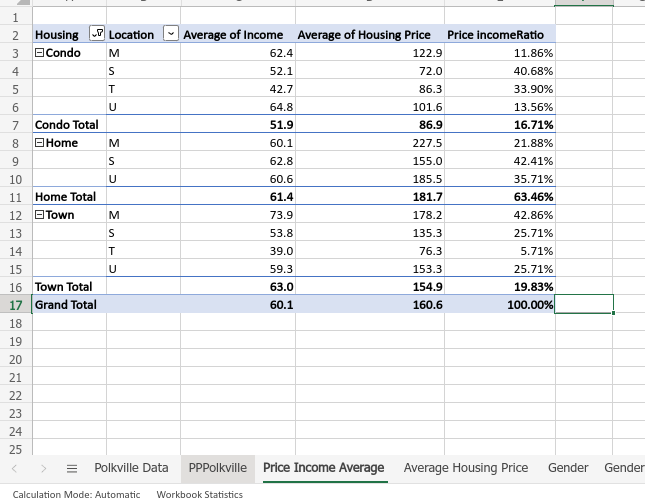
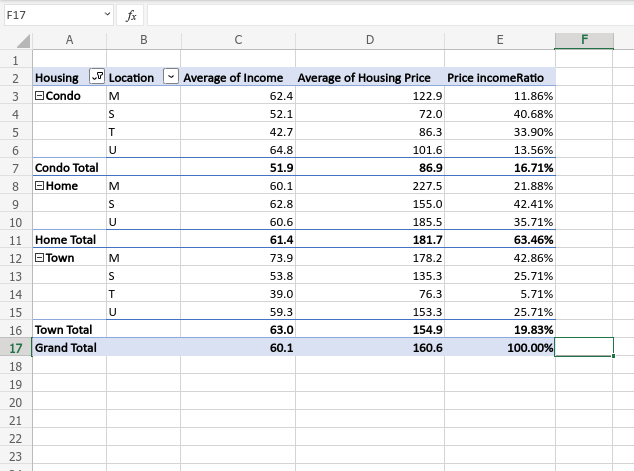
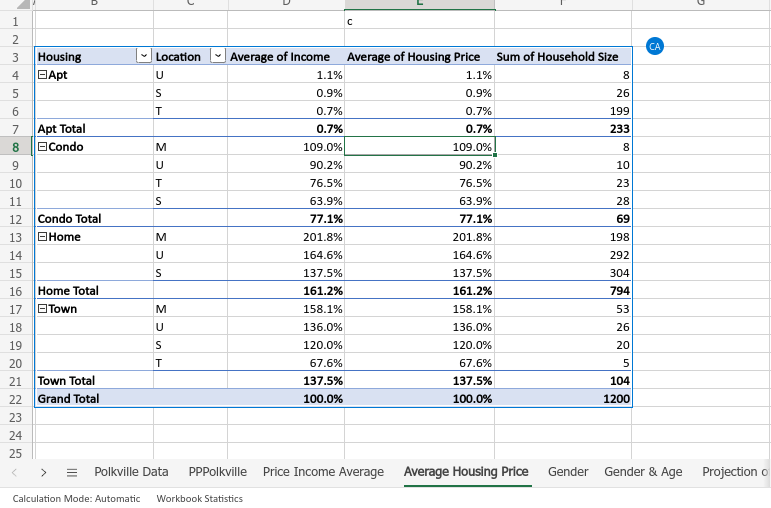
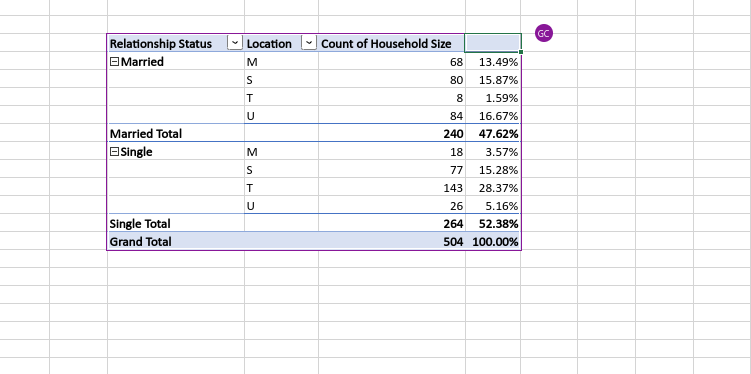
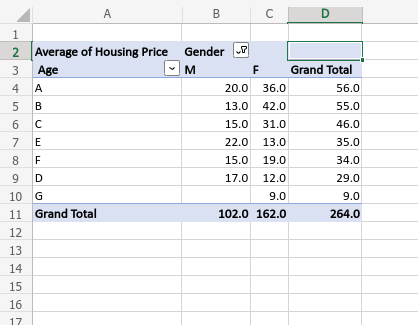
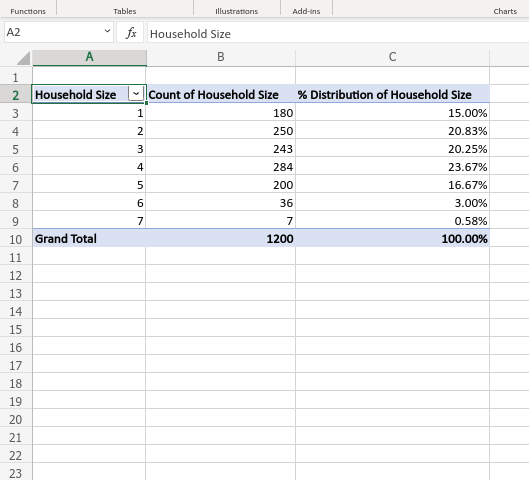
In particular, you are to determine who is interested in your product. This means developing a profile of typical customers in reference to age, gender, martial status, family size, income level and location. Note the similarities and differences these have compared to averages. Develop appropriate price ranges based on past history and incomes. Forecast potential customers. All of these must be supported by metrics from your pivot tables developed using the Polkville database.IN Housing 7 Location *|Average of Income Average of Housing Price Price incomeRatio 3 Condo M 62.4 122.9 11.86% 4 S 52.1 72.0 40.68% 5 T 42.7 86.3 33.90% 6 U 64.8 101.6 13.56% 7 Condo Total 51.9 86.9 16.71% 8 Home M 60.1 227.5 21.88% S 62.8 155.0 42.41% 10 U 60.6 185.5 35.71% 11 Home Total 61.4 181.7 63.46% 12 Town M 73.9 178.2 42.86% 13 S 53.8 135.3 25.71% 14 T 39.0 76.3 5.71% 15 U 59.3 153.3 25.71% 16 Town Total 63.0 154.9 19.83% 17 Grand Total 60.1 160.6 100.00% 18 19 20 21 22 23 24 25 > E Polkville Data PPPolkville Price Income Average Average Housing Price Gender Gender Calculation Mode: Automatic Workbook StatisticsF17 A B C D E F 2 Housing Location *|Average of Income Average of Housing Price Price incomeRatio 3 B Condo M 62.4 122.9 11.86% 4 S 52.1 72.0 40.68% I 42.7 86.3 33.90% 6 U 64.8 101.6 13.56% 7 Condo Total 51.9 86.9 16.71% 8 Home M 60.1 227.5 21.88% g S 62.8 155.0 42.41% 10 U 60.6 185.5 35.71% 11 Home Total 61.4 181.7 63.46% 12 Town M 73.9 178.2 42.86% 13 S 53.8 135.3 25.71% 14 14 39.0 76.3 5.71% 15 U 59.3 153.3 25.71% 16 Town Total 63.0 154.9 19.83% 17 Grand Total 60.1 160.6 100.00% 18 19 20 21 22 23C IN CA Housing *Location *|Average of Income Average of Housing Price Sum of Household Size 4 BApt U 1.1% 1.1% 8 5 S 0.9% 0.9% 26 6 T 0.7% 0.7% 199 7 Apt Total 0.7% 0.7% 233 8 ECondo M 109.0% 109.0% 8 U 90.2% 90.2% 10 10 T 76.5% 76.5% 23 11 S 63.9% 63.9% 28 12 Condo Total 77.1% 77.1% 69 13 BHome M 201.8% 201.8% 198 14 U 164.6% 164.6% 292 15 S 137.5% 137.5% 304 16 Home Total 161.2% 161.2% 794 17 Town M 158.1% 158.1% 53 18 U 136.0% 136.0% 26 19 S 120.0% 120.0% 20 20 67.6% 67.6% 5 21 Town Total 137.5% 137.5% 104 22 Grand Total 100.0% 100.0% 1200 23 24 25 E Polkville Data PPPolkville Price Income Average Average Housing Price Gender Gender & Age Projection o Calculation Mode: Automatic Workbook StatisticsGC Relationship Status Location Count of Household Size Married M 68 13.49% S 80 15.87% T 8 1.59% U 84 16.67% Married Total 240 47.62% Single M 18 3.57% S 77 15.28% T 143 28.37% U 26 5.16% Single Total 264 52.38% Grand Total 504 100.00%\fFunctions Tables Illustrations Add-Ins Charts A2 fx Household Size A B C 2 Household Size Count of Household Size % Distribution of Household Size 3 180 15.00% 2 250 20.83% 5 243 20.25% 4 284 23.67% 5 200 16.67% 36 3.00% g 7 7 0.58% Grand Total 1200 100.00% 11 12 13 14 15 16 17 18 19 20 21 22 23
Step by Step Solution
There are 3 Steps involved in it
Step: 1
Get Instant Access to Expert-Tailored Solutions
See step-by-step solutions with expert insights and AI powered tools for academic success
Step: 2
Step: 3
Ace Your Homework with AI
Get the answers you need in no time with our AI-driven, step-by-step assistance