Question
In Python 2.7 Your task in this programming assignment is to update your previous Python program that implemented the following sorting algorithms: Bubble sort Optimized
In Python 2.7 Your task in this programming assignment is to update your previous Python program that implemented the following sorting algorithms:
Bubble sort Optimized bubble sort Selection sort Insertion sort
Recall that you had each sorting algorithm not only sort a list, but additionally provide the number of comparisons and swaps made during the sorting process! In this program, you will additionally provide the results of each sorting algorithm's comparisons and swaps to a module that will graph them, side-by-side. This module (called plot) will be provided to you.
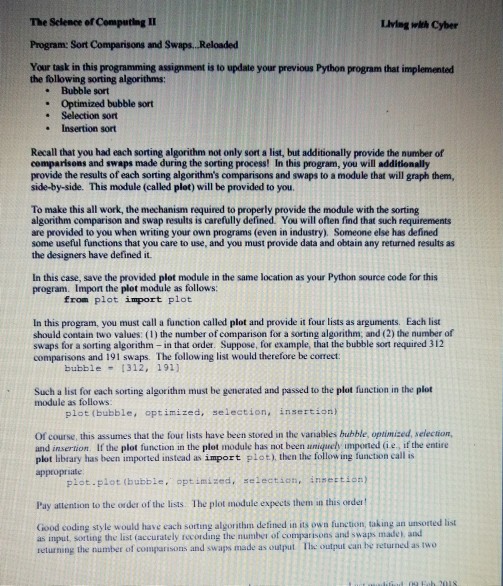
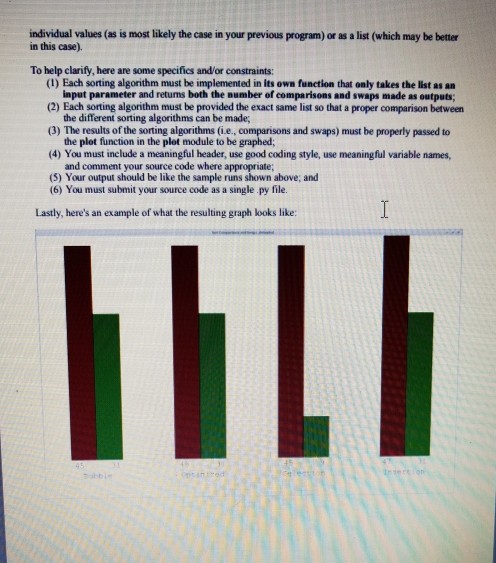
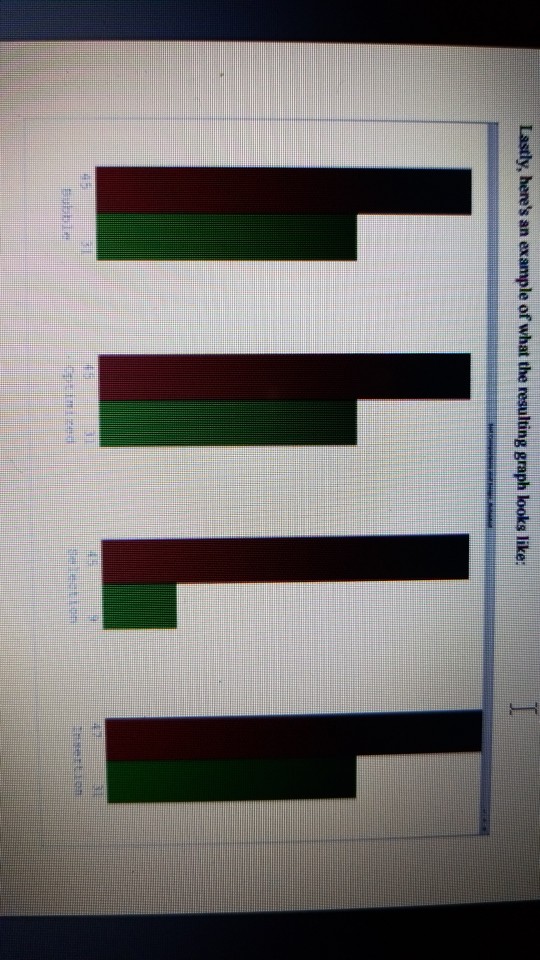
plot.py
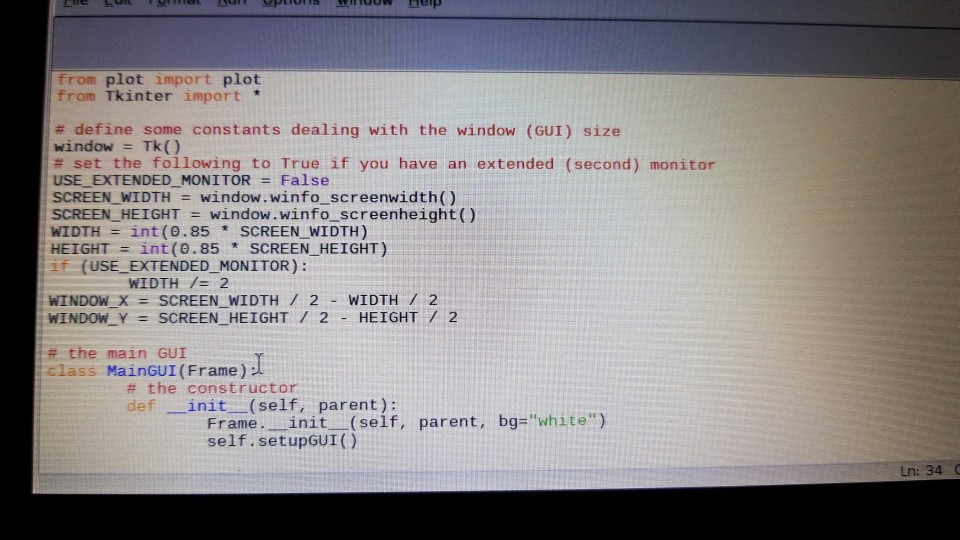
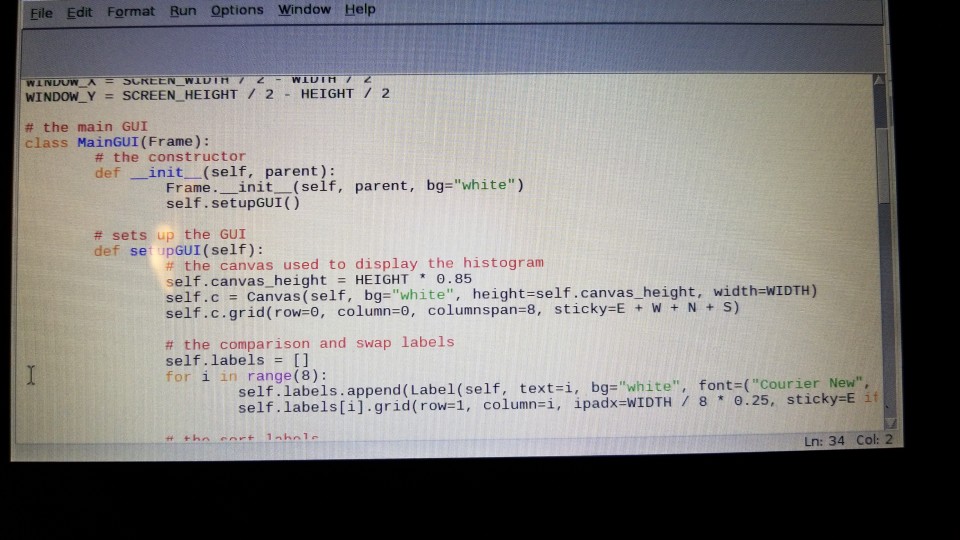
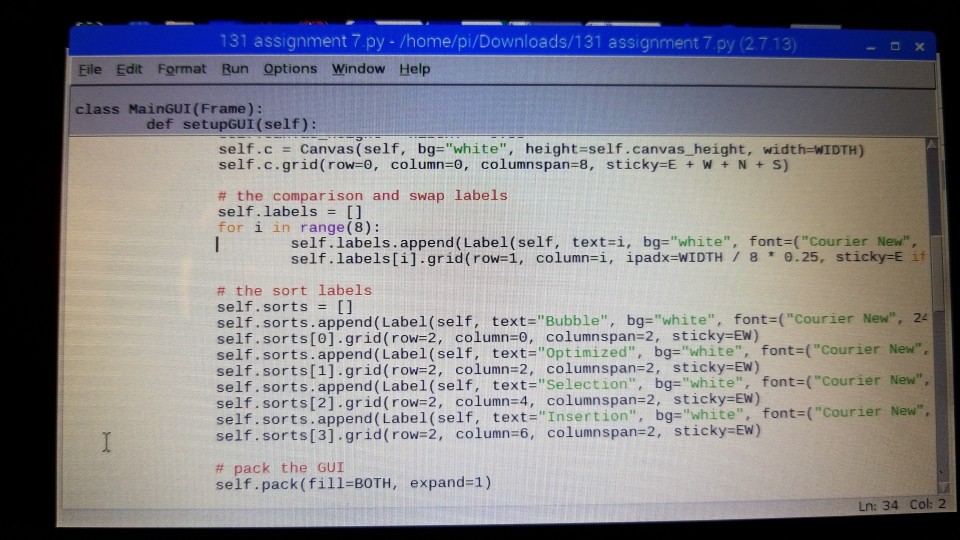
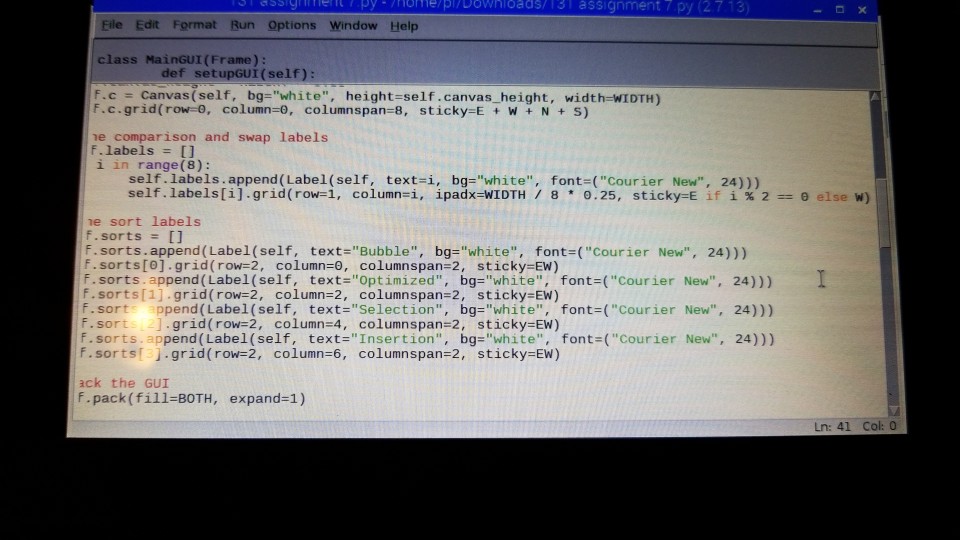
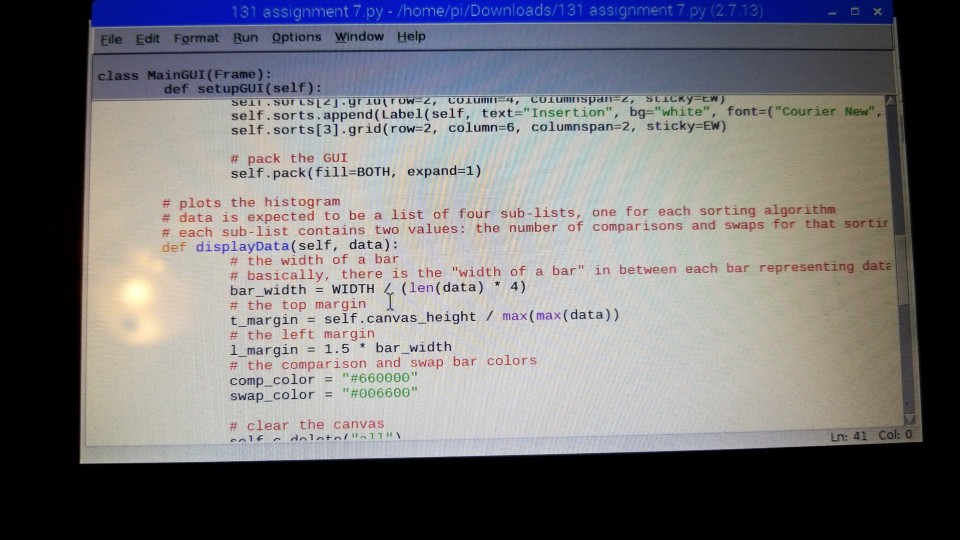
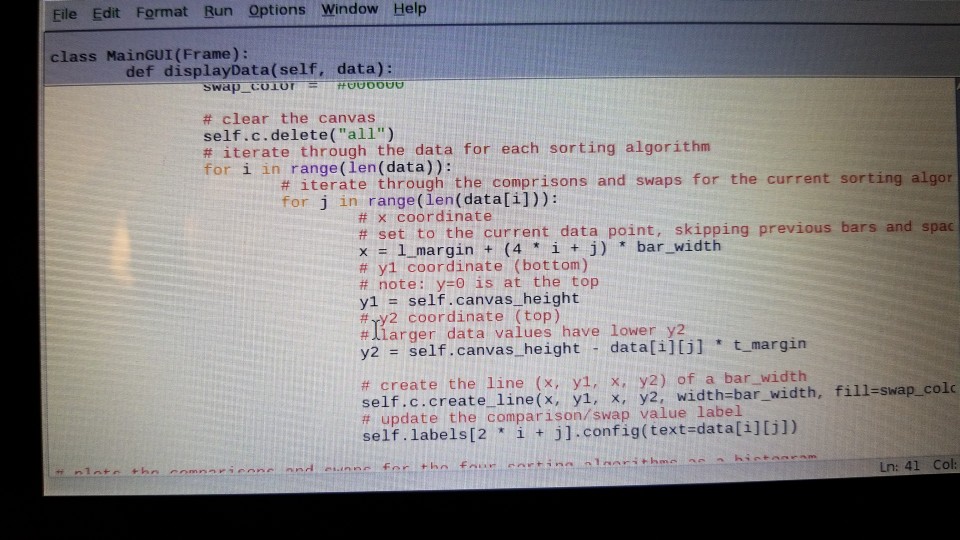
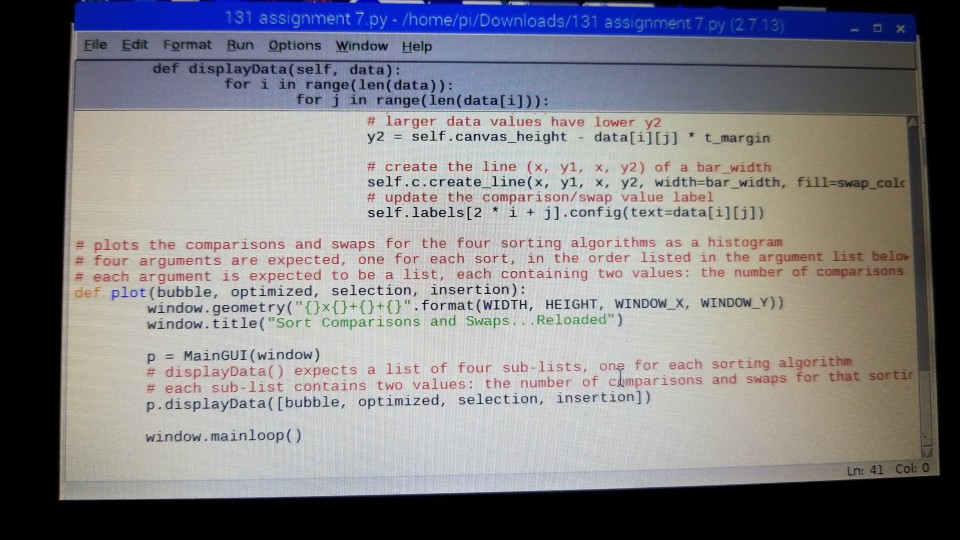
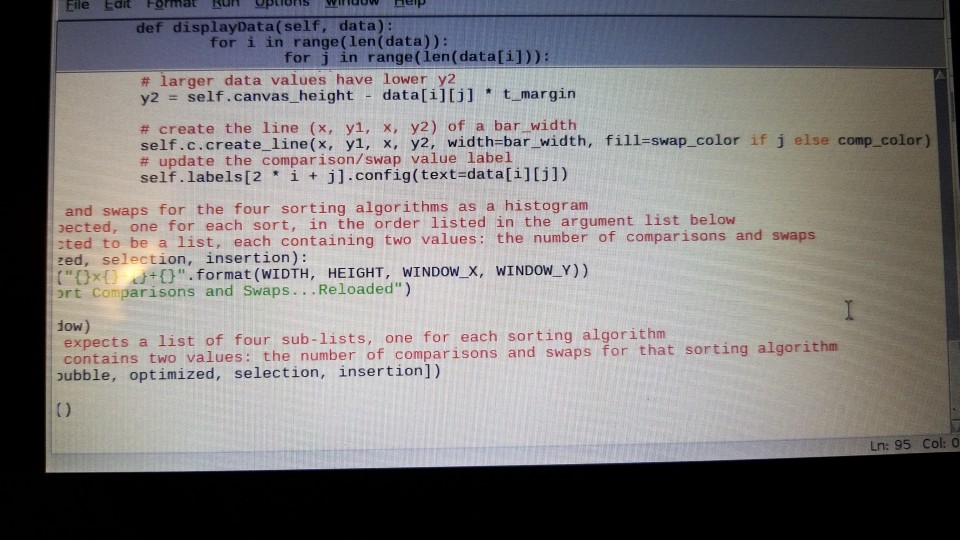
plot code:
from Tkinter import *
# define some constants dealing with the window (GUI) size window = Tk() # set the following to True if you have an extended (second) monitor USE_EXTENDED_MONITOR = False SCREEN_WIDTH = window.winfo_screenwidth() SCREEN_HEIGHT = window.winfo_screenheight() WIDTH = int(0.85 * SCREEN_WIDTH) HEIGHT = int(0.85 * SCREEN_HEIGHT) if (USE_EXTENDED_MONITOR): WIDTH /= 2 WINDOW_X = SCREEN_WIDTH / 2 - WIDTH / 2 WINDOW_Y = SCREEN_HEIGHT / 2 - HEIGHT / 2
# the main GUI class MainGUI(Frame): # the constructor def __init__(self, parent): Frame.__init__(self, parent, bg="white") self.setupGUI()
# sets up the GUI def setupGUI(self): # the canvas used to display the histogram self.canvas_height = HEIGHT * 0.85 self.c = Canvas(self, bg="white", height=self.canvas_height, width=WIDTH) self.c.grid(row=0, column=0, columnspan=8, sticky=E + W + N + S)
# the comparison and swap labels self.labels = [] for i in range(8): self.labels.append(Label(self, text=i, bg="white", font=("Courier New", 24))) self.labels[i].grid(row=1, column=i, ipadx=WIDTH / 8 * 0.25, sticky=E if i % 2 == 0 else W)
# the sort labels self.sorts = [] self.sorts.append(Label(self, text="Bubble", bg="white", font=("Courier New", 24))) self.sorts[0].grid(row=2, column=0, columnspan=2, sticky=EW) self.sorts.append(Label(self, text="Optimized", bg="white", font=("Courier New", 24))) self.sorts[1].grid(row=2, column=2, columnspan=2, sticky=EW) self.sorts.append(Label(self, text="Selection", bg="white", font=("Courier New", 24))) self.sorts[2].grid(row=2, column=4, columnspan=2, sticky=EW) self.sorts.append(Label(self, text="Insertion", bg="white", font=("Courier New", 24))) self.sorts[3].grid(row=2, column=6, columnspan=2, sticky=EW)
# pack the GUI self.pack(fill=BOTH, expand=1)
# plots the histogram # data is expected to be a list of four sub-lists, one for each sorting algorithm # each sub-list contains two values: the number of comparisons and swaps for that sorting algorithm def displayData(self, data): # the width of a bar # basically, there is the "width of a bar" in between each bar representing data bar_width = WIDTH / (len(data) * 4) # the top margin t_margin = self.canvas_height / max(max(data)) # the left margin l_margin = 1.5 * bar_width # the comparison and swap bar colors comp_color = "#660000" swap_color = "#006600"
# clear the canvas self.c.delete("all") # iterate through the data for each sorting algorithm for i in range(len(data)): # iterate through the comprisons and swaps for the current sorting algorithm for j in range(len(data[i])): # x coordinate # set to the current data point, skipping previous bars and spaces in between them x = l_margin + (4 * i + j) * bar_width # y1 coordinate (bottom) # note: y=0 is at the top y1 = self.canvas_height # y2 coordinate (top) # larger data values have lower y2 y2 = self.canvas_height - data[i][j] * t_margin
# create the line (x, y1, x, y2) of a bar_width self.c.create_line(x, y1, x, y2, width=bar_width, fill=swap_color if j else comp_color) # update the comparison/swap value label self.labels[2 * i + j].config(text=data[i][j])
# plots the comparisons and swaps for the four sorting algorithms as a histogram # four arguments are expected, one for each sort, in the order listed in the argument list below # each argument is expected to be a list, each containing two values: the number of comparisons and swaps def plot(bubble, optimized, selection, insertion): window.geometry("{}x{}+{}+{}".format(WIDTH, HEIGHT, WINDOW_X, WINDOW_Y)) window.title("Sort Comparisons and Swaps...Reloaded")
p = MainGUI(window) # displayData() expects a list of four sub-lists, one for each sorting algorithm # each sub-list contains two values: the number of comparisons and swaps for that sorting algorithm p.displayData([bubble, optimized, selection, insertion])
window.mainloop()
The Sclence of Computing II Program: Sort Comparisons and Swaps. Reloaded Your task in this programming assignment is to update your previous Python program that implemented Living with Cyber the following sorting algorithms . Bubble sort Optimized bubble sort . Selection sort e Insertion sort Recall that you had each sorting algorithm not only sort a list, but additionally provide the number of comparisons and swaps made during the sorting process! In this program, you will additionally provide the results of each sorting algorithms comparisons and swaps to a module that will graph them, side-by-side. This module (called plot) will be provided to you. To make this all work, the mechanism required to properly provide the module with the sorting algorithm comparison and swap results is carefully defined. You will often find that such requirements are provided to you when writing your own programs (even in industry). Someone else has defined some useful functions that you care to use, and you must provide data and obtain any returned results as the designers have defined it. In this case, save the provided plot module in the same location as your Python source code for this program. Import the plot module as follows: from plot import plot In this program, you must call a function called plot and provide it four lists as arguments. Each list should contain two values: (1) the number of comparison for a sorting algorithm, and (2) the number of swaps for a sorting algorithm - in that order. Suppose, for example, that the bubble sont required 312 comparisons and 191 swaps. The following list would therefore be correct bubble 1312,191) Such a list for each sorting algorithm must be generated and passed to the plot function in the plot module as follows plot (bubble, optimized, selection, insertion) Of course, this assumes that the four lists have been stored in the variables bubble, optimized, selection, and insertion. If the plot function in the plot module has not been uniquety impoted G e, if the entire plot library has been imported instead as import plot), then the follow ing function call is approprsate plot.plot (bubble. optimized, selection, insertion) Pay attention to the order of the lists The plot module expects them in this ordel Good coding style would have each sorting algorithm detined in its own function, taking an unsotted list as imput sorting the list (accurately recording the number of comparisons and swaps made, and returning the number of comparisons and swaps made as output The output can he returned as two The Sclence of Computing II Program: Sort Comparisons and Swaps. Reloaded Your task in this programming assignment is to update your previous Python program that implemented Living with Cyber the following sorting algorithms . Bubble sort Optimized bubble sort . Selection sort e Insertion sort Recall that you had each sorting algorithm not only sort a list, but additionally provide the number of comparisons and swaps made during the sorting process! In this program, you will additionally provide the results of each sorting algorithms comparisons and swaps to a module that will graph them, side-by-side. This module (called plot) will be provided to you. To make this all work, the mechanism required to properly provide the module with the sorting algorithm comparison and swap results is carefully defined. You will often find that such requirements are provided to you when writing your own programs (even in industry). Someone else has defined some useful functions that you care to use, and you must provide data and obtain any returned results as the designers have defined it. In this case, save the provided plot module in the same location as your Python source code for this program. Import the plot module as follows: from plot import plot In this program, you must call a function called plot and provide it four lists as arguments. Each list should contain two values: (1) the number of comparison for a sorting algorithm, and (2) the number of swaps for a sorting algorithm - in that order. Suppose, for example, that the bubble sont required 312 comparisons and 191 swaps. The following list would therefore be correct bubble 1312,191) Such a list for each sorting algorithm must be generated and passed to the plot function in the plot module as follows plot (bubble, optimized, selection, insertion) Of course, this assumes that the four lists have been stored in the variables bubble, optimized, selection, and insertion. If the plot function in the plot module has not been uniquety impoted G e, if the entire plot library has been imported instead as import plot), then the follow ing function call is approprsate plot.plot (bubble. optimized, selection, insertion) Pay attention to the order of the lists The plot module expects them in this ordel Good coding style would have each sorting algorithm detined in its own function, taking an unsotted list as imput sorting the list (accurately recording the number of comparisons and swaps made, and returning the number of comparisons and swaps made as output The output can he returned as twoStep by Step Solution
There are 3 Steps involved in it
Step: 1

Get Instant Access to Expert-Tailored Solutions
See step-by-step solutions with expert insights and AI powered tools for academic success
Step: 2

Step: 3

Ace Your Homework with AI
Get the answers you need in no time with our AI-driven, step-by-step assistance
Get Started


