in python language

it is not clear in previous photo.

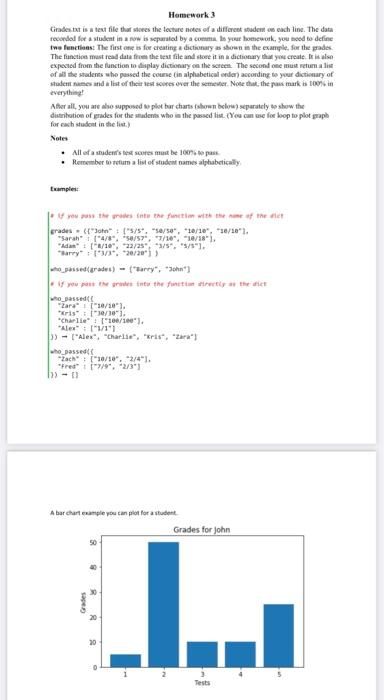
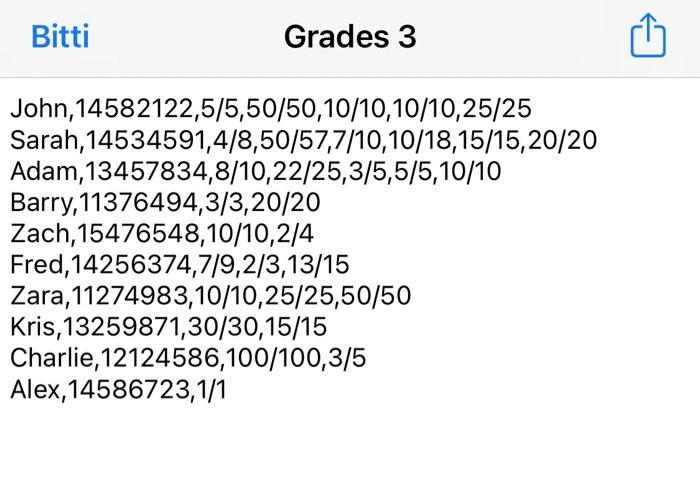
You will find a text file named Grades.txt in the attachment to perform the task asked in the homework. You do not need to draw a flowchart. Homework 3 Citades.txt is a text file that sees the lecture notes of a different student nach line. The data recordel for a student in a row is separated by a comme to your homework, you need to define twe functions. The first one is for creating a dictionary as shown in the example for the grades The function must read data from the text file and store it in dictionary that you create. Er is also expected from the function to display dictionary on the screen. The second one must retum ali of all the students who passed the course in alphabetical order) according to your dictionary of student names and a list of their test scores over the semester. Note that the pas mark is 100% everything! After all, you are also supposed toplot bar charts shown below) separately to show the distribution of grades for the students who in the passed list. (You can use le doop te plot graph for each student in the list.) Notes . All of a student's test scores must be 100% te past . Remember to return a list of student names alphabetically Examples: the rest the pain with the grades ("30":["5/5","5/5", *10/10, 80/10*1. Sarah 14/8", 56/97, 7/10 10/18". R/10 22/253/5", "5/5"). Barry* : **** 20/20 _passedgradet) - Barry", hr") who_passed "Zara" (10/10) Kris" 19/01 Charlie [*100/100"). "Alex":["1/11 - "Alex", "Charlie", "kris, "Zara" whe_passed Zach": "10/2", 3/4"). "Fred" 17/9", "2/3") >> - A barcharanple you can plot for a student Grades for John 8 Grades 8 L. Tests Bitti Grades 3 John,14582122,5/5,50/50,10/10,10/10,25/25 Sarah,14534591,4/8,50/57,7/10,10/18,15/15, 20/20 Adam,13457834,8/10,22/25,3/5,5/5,10/10 Barry,11376494,3/3,20/20 Zach,15476548,10/10,2/4 Fred, 14256374,7/9,2/3,13/15 Zara, 11274983,10/10,25/25,50/50 Kris, 13259871,30/30,15/15 Charlie, 12124586,100/100,3/5 Alex, 14586723,1/1 Homework 3 Citades.txt is a text file that sees the lecture notes of a different student nach line. The data recordel for a student in a row is separated by a comme to your homework, you need to define twe functions. The first one is for creating a dictionary as shown in the example for the grades The function must read data from the text file and store it in dictionary that you create. Er is also expected from the function to display dictionary on the screen. The second one must retum ali of all the students who passed the course in alphabetical order) according to your dictionary of student names and a list of their test scores over the semester. Note that the pas mark is 100% everything! After all, you are also supposed toplot bar charts shown below) separately to show the distribution of grades for the students who in the passed list. (You can use le doop te plot graph for each student in the list.) Notes . All of a student's test scores must be 100% te past . Remember to return a list of student names alphabetically Examples: the rest the pain with the grades ("30":["5/5","5/5", *10/10, 80/10*1. Sarah 14/8", 56/97, 7/10 10/18". R/10 22/253/5", "5/5"). Barry* : **** 20/20 _passedgradet) - Barry", hr") who_passed "Zara" (10/10) Kris" 19/01 Charlie [*100/100"). "Alex":["1/11 - "Alex", "Charlie", "kris, "Zara" whe_passed Zach": "10/2", 3/4"). "Fred" 17/9", "2/3") >> - A barcharanple you can plot for a student Grades for John 8 Grades 8 L. Tests


