Question
In R codeing Use K-means to cluster the dataset ds we have used in the first part of this lab, then plot the points, the
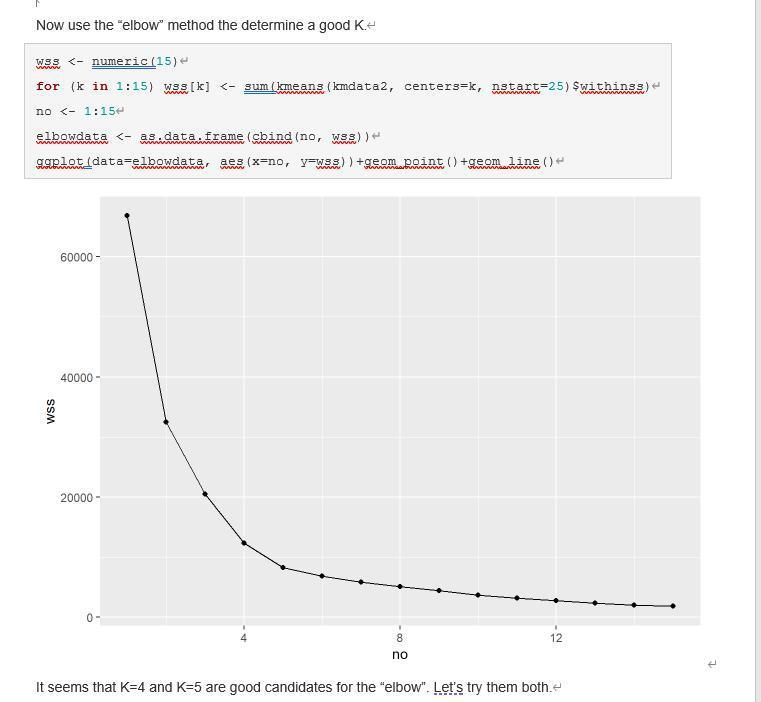
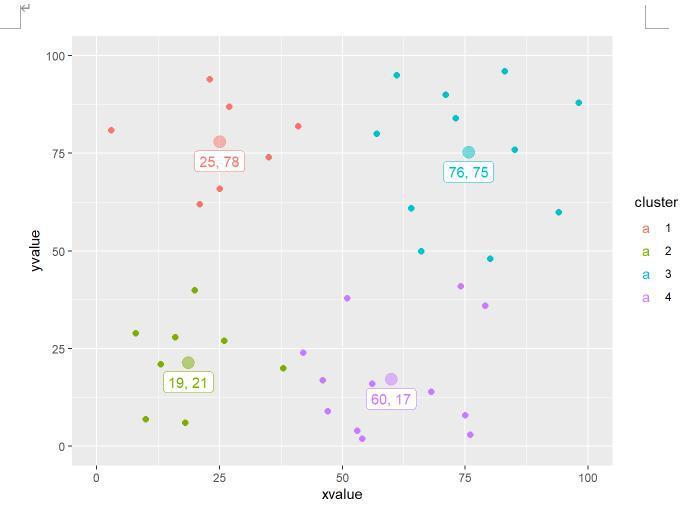
In R codeing Use K-means to cluster the dataset ds we have used in the first part of this lab, then plot the points, the clusters, and the centers together with different colors. First, use the elbow method to find the number of clusters, K. Finally, summarize the results. *Similar output is at the bottom install.packages("ggplot2") library(ggplot2)
data(mtcars)
head(mtcars, 10)
ds# convert the cyl into factor (labels)ds$cylds## mpg cyl wt
## Mazda RX4 21.0 6 2.620
## Mazda RX4 Wag 21.0 6 2.875
## Datsun 710 22.8 4 2.320
## Hornet 4 Drive 21.4 6 3.215
## Hornet Sportabout 18.7 8 3.440
## Valiant 18.1 6 3.460
## Duster 360 14.3 8 3.570
## Merc 240D 24.4 4 3.190
## Merc 230 22.8 4 3.150
## Merc 280 19.2 6 3.440
## Merc 280C 17.8 6 3.440
## Merc 450SE 16.4 8 4.070
## Merc 450SL 17.3 8 3.730
## Merc 450SLC 15.2 8 3.780
## Cadillac Fleetwood 10.4 8 5.250
## Lincoln Continental 10.4 8 5.424
## Chrysler Imperial 14.7 8 5.345
## Fiat 128 32.4 4 2.200
## Honda Civic 30.4 4 1.615
## Toyota Corolla 33.9 4 1.835
## Toyota Corona 21.5 4 2.465
## Dodge Challenger 15.5 8 3.520
## AMC Javelin 15.2 8 3.435
## Camaro Z28 13.3 8 3.840
## Pontiac Firebird 19.2 8 3.845
## Fiat X1-9 27.3 4 1.935
## Porsche 914-2 26.0 4 2.140
## Lotus Europa 30.4 4 1.513
## Ford Pantera L 15.8 8 3.170
## Ferrari Dino 19.7 6 2.770
## Maserati Bora 15.0 8 3.570
## Volvo 142E 21.4 4 2.780
**Example out put:** Similar output
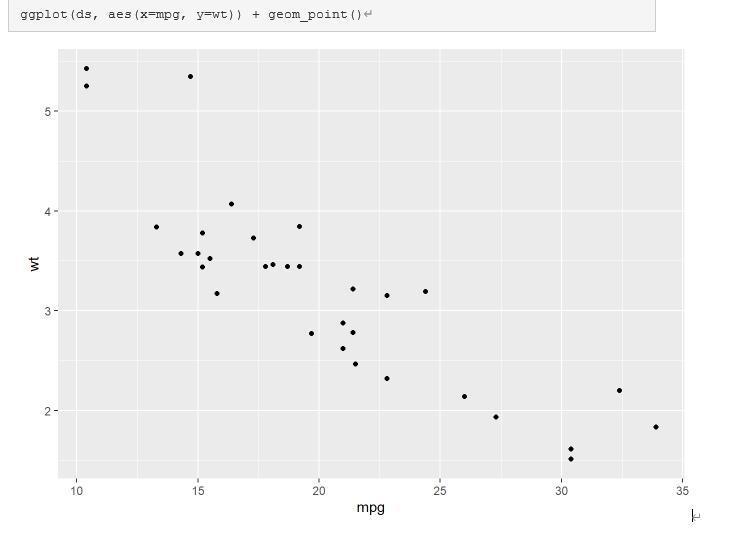
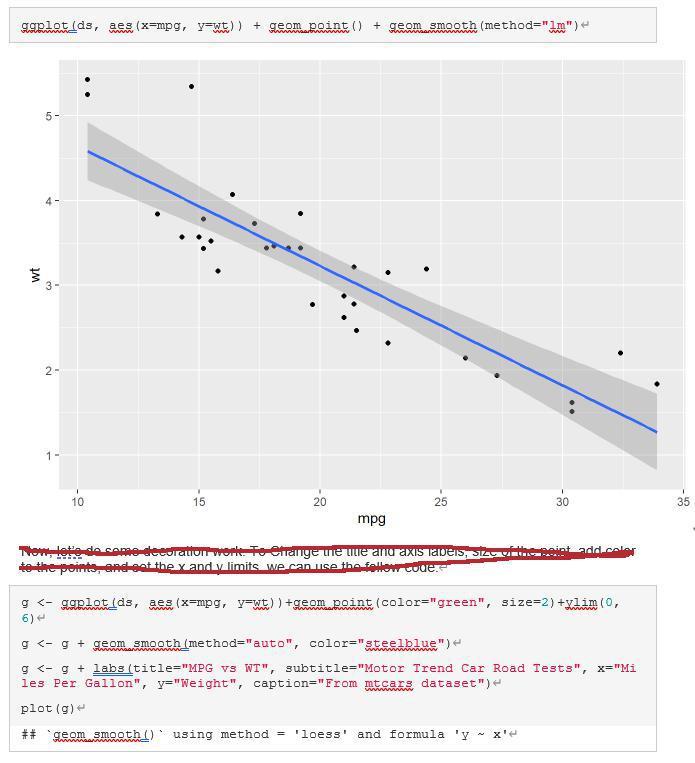
ggplot (ds, aes (x=mpg, y=wt)) + geom_point () 5- 4- wt 3- 2 - 10 15 20 25 30 35 mpg gopiat (ds, aes (x=mpg, y=wt)) + geom point () + geom smooth (method="10") 5- wt 3- 23 1 - 1 10 15 25 35 20 30 mpg Now lote de come decoration work to errange the tue and axis Tavers, sowie int add color to the points, and at the x and v limits we can use the follow coue. g
Step by Step Solution
There are 3 Steps involved in it
Step: 1

Get Instant Access to Expert-Tailored Solutions
See step-by-step solutions with expert insights and AI powered tools for academic success
Step: 2

Step: 3

Ace Your Homework with AI
Get the answers you need in no time with our AI-driven, step-by-step assistance
Get Started


