Question
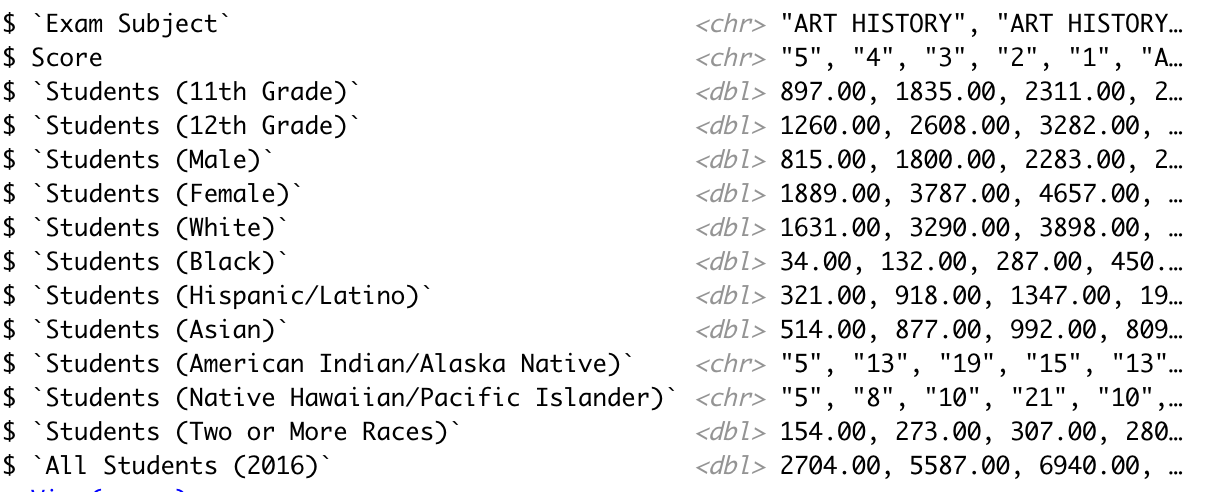
In R please help, below is a picture of table > Question 1: How many students, from `All Students (2016)` (i.e., from all the students
In R please help, below is a picture of table
> Question 1: How many students, from `All Students (2016)` (i.e., from all the students that took AP ex4m in 2016), got each score (from 1 to 5) across different ex4m subjects.
1. start with the object you created when you `read_csv()`
1. filter out Scores that are "All" and "Average" (keep scores that are from 1 to 5)
1. start a ggplot with the following in mind: score is your sequential variable, `All Students (2016)` is your numeric variable (with student counts), and `Ex4m Subject` is your categorical variable. 1
. use `geom_line` to draw a line plot 1. make any other adjustments to make your plot clearer (e.g., use `facet_wrap`, change scales, add a caption)

Step by Step Solution
There are 3 Steps involved in it
Step: 1

Get Instant Access to Expert-Tailored Solutions
See step-by-step solutions with expert insights and AI powered tools for academic success
Step: 2

Step: 3

Ace Your Homework with AI
Get the answers you need in no time with our AI-driven, step-by-step assistance
Get Started


