

Question: In September 1954, using $500 to buy some basic equipment and a bicycle for deliveries, the Saputo family founded the company in Montreal bearing their
In September 1954, using $500 to buy some basic equipment and a bicycle for deliveries, the Saputo family founded the company in Montreal bearing their name. Today, Saputo produces, markets, and distributes a range of food products, including cheese, milk, yogurt, and dairy ingredients. Saputo is the largest dairy processor in Canada, and is among the 10 largest in the world, including the largest in Australia, the second-largest in Argentina, and among the top three cheese producers in the United States. With 67 manufacturing facilities, 70 distribution centres, and approximately 18,600 employees around the world, Saputo's products are sold in more than 60 countries. The company processes approximately 11 billion litres of raw milk per year, and remains focused on being better and stronger through optimization of its activities, product innovation, and acquisitions. One of the ways that Saputo plans on increasing its efficiencies is by investing in sales and operational planning processes, and one of the keys to doing this is forecasting. By improving its forecasting, the company will use plant, distribution, and transportation resources more effectively, resulting in cost reductions and enhanced customer service. In the coming years, Saputo and other dairy processors will need to focus on creating innovative dairy products that match the changing nutritional needs of consumers, who are becoming increasingly sophisticated. With the strong and growing dairy products market, Saputo sees opportunities to penetrate new markets and improve sales in existing core markets. Understanding customers, as well as the operational requirements of doing so efficiently, are at the heart of a demand-forecasting review process. With demand growth in mind, the goal is to be a distribution and logistics provider with superior levels of service and performance that is as cost efficient as possible. Saputo operates their business through five geographic divisions: 1. Canada
2. USA
3. Europe
4. Argentina
5. Australia
Saputo groups their portfolio of products into five categories:
1. Cheese
2. Dairy foods
3. Milk
4. By-Products / Ingredients
5. Non-Dairy Products
Additional information:
about Saputo is available on the Investor Factsheet and the Corporate Presentation available in the Project folder, or at saputo.com. Saputo. (2022, August 3)
https://www.saputo.com/en/investors
PROJECT REQUIREMENTS
Saputo has engaged your consulting firm to help them develop forecasting models for two products from one of their geographic divisions. The division and products which have been assigned to your firm are included in the file: One of the forecasting models will be used for longer-range budgeting and strategic planning, while the other will be used for shorter-term operations planning. The Excel file also contains historical sales data for each product (monthly from Jan. 2020 - Dec. 2022). Units of measure for the data are in 'millions of litres equivalent' (for comparison purposes, all products are described in the same units of measurement based on how much raw material milk is required to produce the sales volume for the given product). Note that the data provided is for educational purposes only, and does not reflect actual Saputo sales. Your firm's task is to develop an appropriate forecasting model for each product for the purpose specified, and then to use the models to forecast sales demand for the time period specified.
a written report
(a) Summarize the process used to determine each forecasting model, including:
? A description of the forecasting models recommended.
? An explanation of why the forecasting models are recommended.
? Any other models which were considered, and why they were not recommended.
(b) State the forecasts:
? Based on the recommended models, provide the forecast for the time period specified for each product.
(c) Describe potential forecast adjustments to consider:
? Per step 9 of the forecasting process, describe any adjustments to the forecast you would consider and/or recommend, based on qualitative information or insight.
? Feel free to conduct external research on current information or trends for food products for the countries and/or products which have been assigned to your firm.
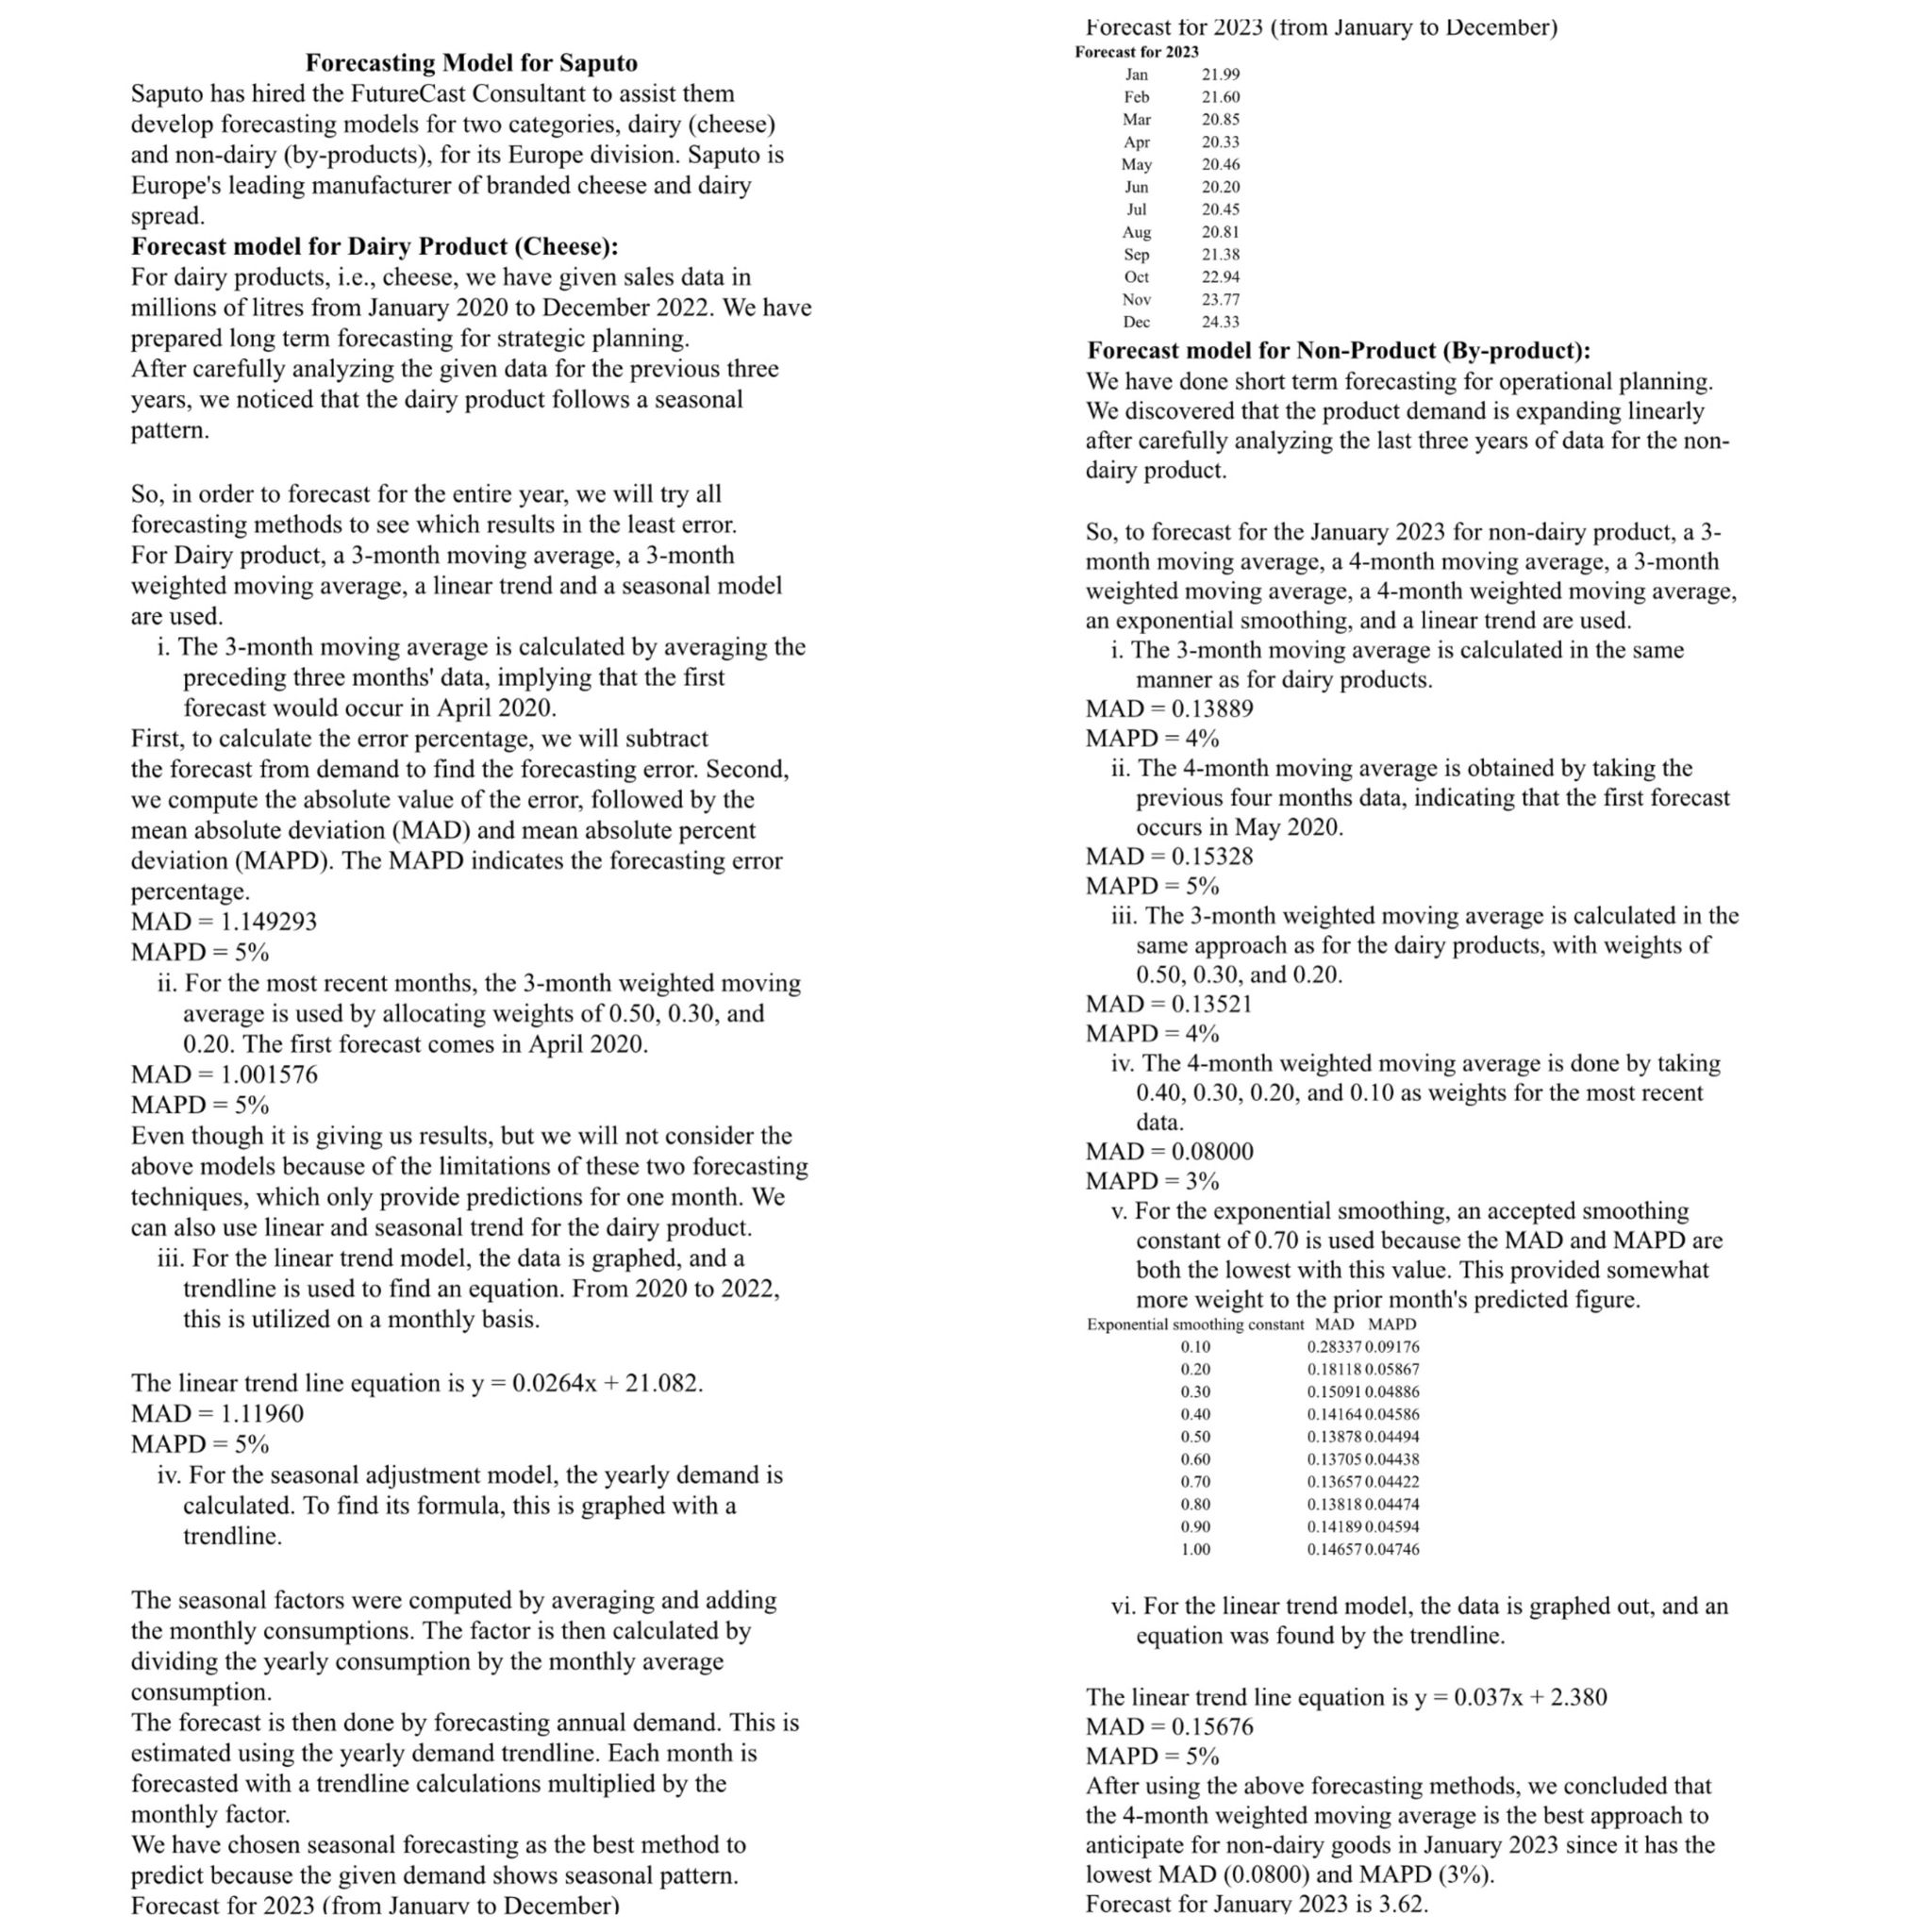
Forecasting Model for Saputo Saputo has hired the FutureCast Consultant to assist them develop forecasting models for two categories, dairy (cheese) and non-dairy (by-products), for its Europe division. Saputo is Europe's leading manufacturer of branded cheese and dairy spread. Forecast model for Dairy Product (Cheese): For dairy products, i.e., cheese, we have given sales data in millions oflitres from January 2020 to December 2022. We have prepared long term forecasting for strategic planning. After carefully analyzing the given data for the previous three years, we noticed that the dairy product follows a seasonal pattern. So, in order to forecast for the entire year, we will try all forecasting methods to see which results in the least error. For Dairy product, a 3-month moving average, a 3-month weighted moving average, a linear trend and a seasonal model are used. i. The 3-month moving average is calculated by averaging the preceding three months' data, implying that the rst forecast would occur in April 2020. First, to calculate the error percentage, we will subtract the forecast from demand to nd the forecasting error. Second, we compute the absolute value of the error, followed by the mean absolute deviation (MAD) and mean absolute percent deviation (MAPD). The MAPD indicates the forecasting error percentage. MAD : 1.149293 MAPD = 5% ii. For the most recent months, the 3-month weighted moving average is used by allocating weights of 0.50, 0.30, and 0.20. The rst forecast comes in April 2020. MAD = 1.001576 MAPD = 5% Even though it is giving us results, but we will not consider the above models because of the limitations of these two forecasting techniques, which only provide predictions for one month. We can also use linear and seasonal trend for the dairy product. iii. For the linear trend model, the data is graphed, and a trendline is used to nd an equation. From 2020 to 2022, this is utilized on a monthly basis. The linear trend line equation is y = 0.0264x + 21.082. MAD = 1.1l960 MAPD = 5% iv. For the seasonal adjustment model, the yearly demand is calculated. To nd its formula, this is graphed with a trendline. The seasonal factors were computed by averaging and adding the monthly consumptions. The factor is then calculated by dividing the yearly consumption by the monthly average consumption. The forecast is then done by forecasting annual demand. This is estimated using the yearly demand trendline. Each month is forecasted with a trendline calculations multiplied by the monthly factor. We have chosen seasonal forecasting as the best method to predict because the given demand shows seasonal pattem. Forecast for 2023 ( from Januarv to December) forecast tor 2025 (trom January to December) Forecast for 2023 Jan 21 99 Feb 21 '10 Mar 20 135 Apr :0 3.1 May 20 46 Jun 20 20 Jul 20 45 Aug 2081 Sen 2] .31' Oct 22 94 Nov 23.77 Dec 24 3] Forecast model for Non-Product (By-product): We have done short term forecasting for operational planning. We discovered that the product demand is expanding iinearly aer carefully analyzing the last three years of data for the non- dairy product. So, to forecast for the January 2023 for nondairy product, a 3 month moving average, a 14-month moving average, a 3-month weighted moving average, a 4-month weighted moving average, an exponential smoothing, and a linear trend are used. i. The 3-month moving average is calculated in the same manner as for dairy products. MAD = 0.13889 MAPD = 4% ii. The 4-month moving average is obtained by taking the previous four months data. indicating that the rst forecast occurs in May 2020. MAD = 0.15328 MAPD = 5% iii. The 3-month weighted moving average is calculated in the same approach as for the dairy products, with weights of 0.50, 0.30, and 0.20. MAD = 0.1352l MAPD = 4% iv. The 4-month weighted moving average is done by taking 0.40, 0.30, 0.20, and 0.10 as weights for the most recent data. MAD = 0.08000 MAPD : 3% v. For the exponential smoothing, an accepted smoothing constant of 0.70 is used because the MAD and MAPD are both the lowest with this value. This provided somewhat more weight to the prior month's predicted gure. Exponential smoothing constant MAD MAPD 0.10 0.23337 0.09176 0 20 1.). 1)\" IE 0 053157 0.30 0.1509I 0.041106 0.40 1114164004586 050 0.l37004494 0.130 0. l 3705 0.04438 0,70 0.1.3657 0 04422 0.80 0.138"; 0.04474 0 90 0 14E890ll4594 l.00 0.14657 0 04746 vi. For the linear trend model, the data is graphed out, and an equation was found by the trendline. The linear trend line equation is y = 0.037x + 2.380 MAD = 0.15676 MAPD = 5% After using the above forecasting methods, we concluded that the 4-month weighted moving average is the best approach to anticipate for nondairy goods in January 2023 since it has the lowest MAD (0.0800) and MAPD (3%). Forecast for January 2023 is 3.62
Step by Step Solution
There are 3 Steps involved in it

Get step-by-step solutions from verified subject matter experts