

Answered step by step
Verified Expert Solution
Question
1 Approved Answer
In Table 4 below you will find DAILY PRICE data for 10 stocks as well as for a Major Local Share Index (INDEX). Note: any
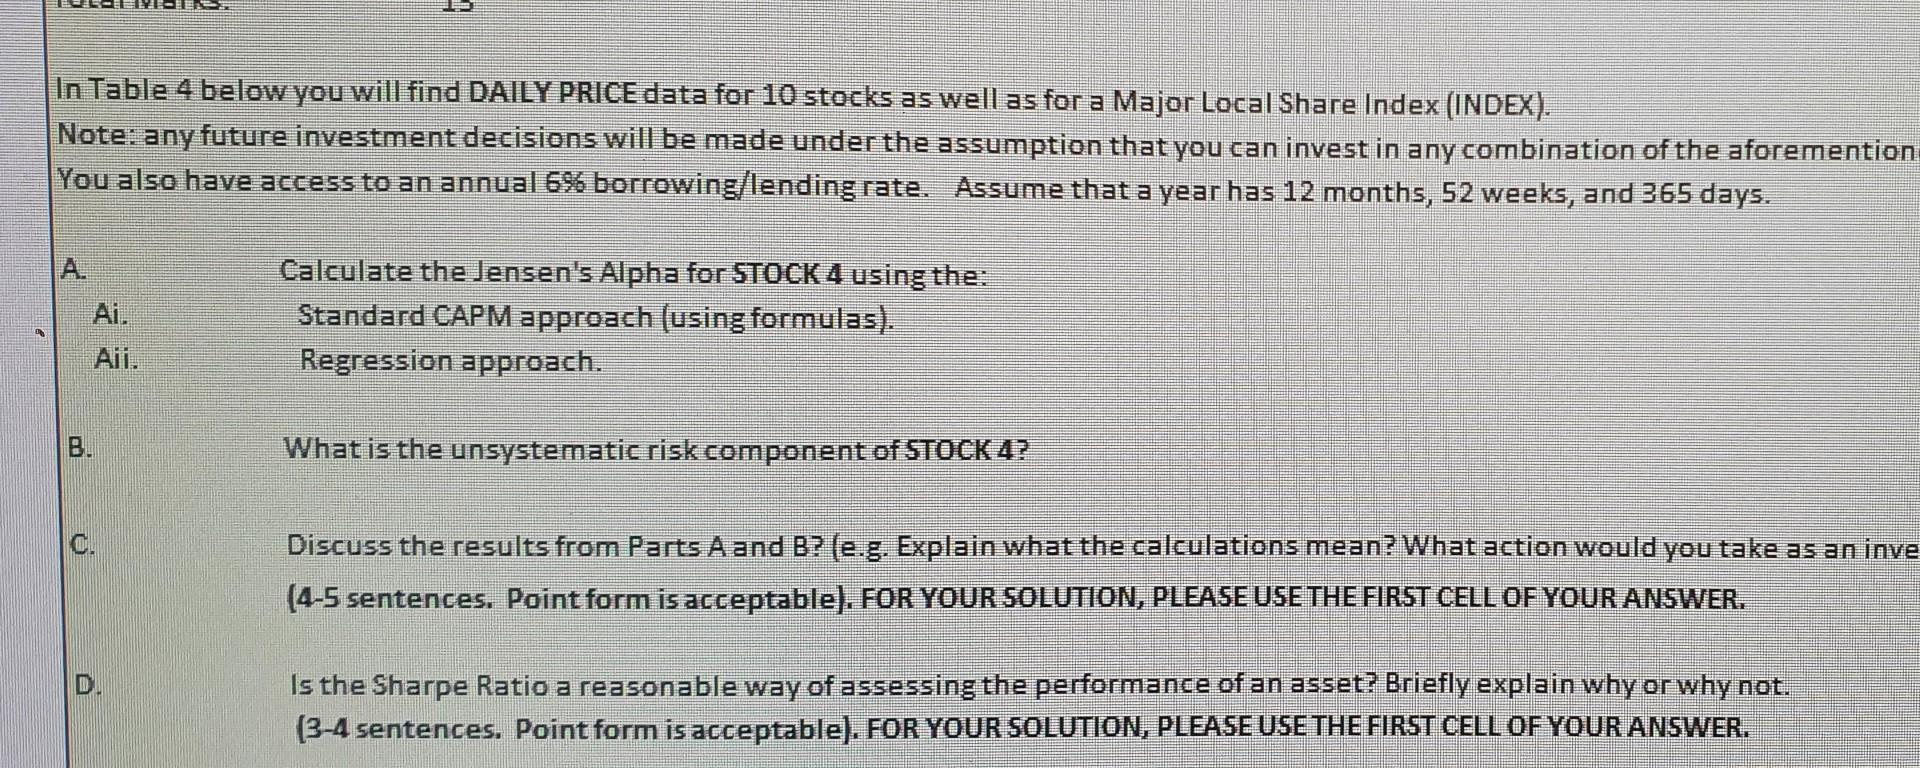
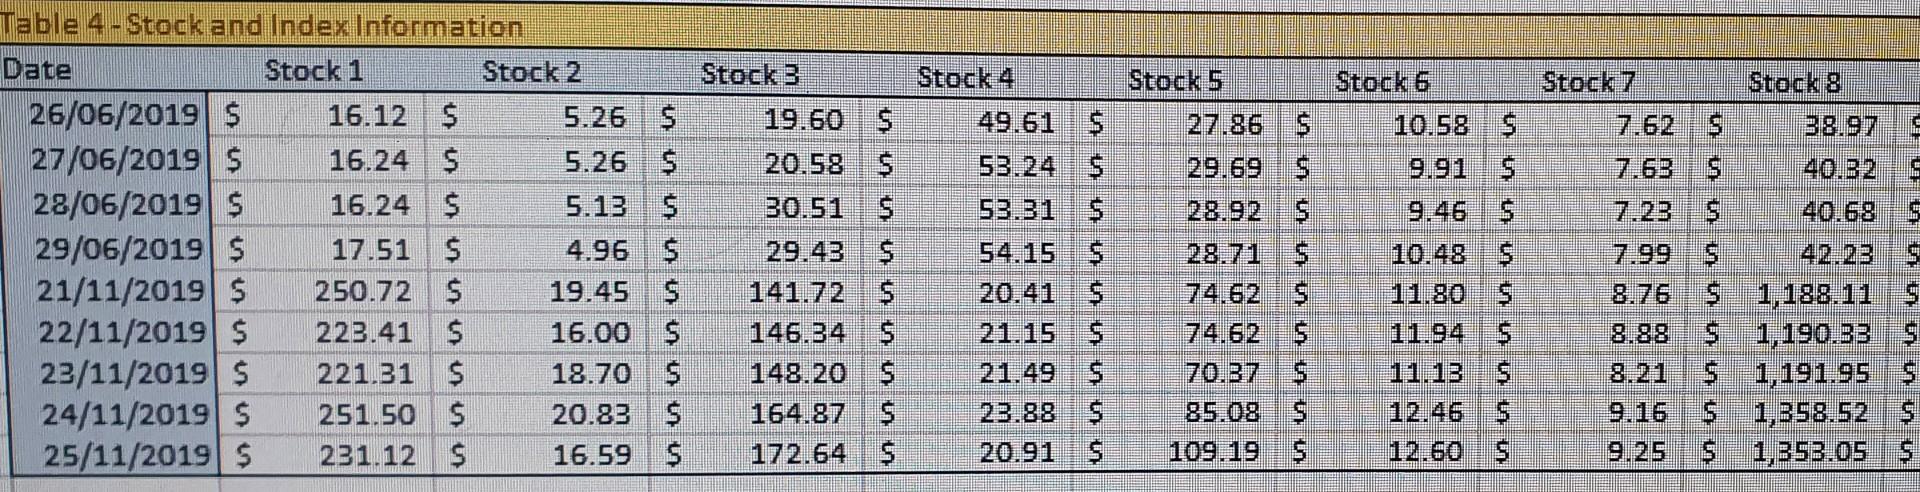
In Table 4 below you will find DAILY PRICE data for 10 stocks as well as for a Major Local Share Index (INDEX). Note: any future investment decisions will be made under the assumption that you can invest in any combination of the aforemention You also have access to an annual 6% borrowing/lending rate. Assume that a year has 12 months, 52 weeks, and 365 days. Calculate the Jensen's Alpha for STOCK 4 using the: Standard CAPM approach (using formulas). Regression approach. Aii. B What is the unsystematic risk component of STOCK 4? C. Discuss the results from Parts A and B? (e.g. Explain what the calculations mean? What action would you take as an inve (4-5 sentences. Point form is acceptable). FOR YOUR SOLUTION, PLEASE USE THE FIRST CELL OF YOUR ANSWER. D Is the Sharpe Ratio a reasonable way of assessing the performance of an asset? Briefly explain why or why not. (3-4 sentences. Point form is acceptable). FOR YOUR SOLUTION, PLEASE USE THE FIRST CELL OF YOUR ANSWER. Stock 3 Stock 4 Stock 5 Stock 7 Stock 6 10.58 $ T E2 = Table 4-Stock and Index Information Date Stock 1 Stock 2 26/06/2019 $ 16.12 $ 5.26 $ 27/06/2019 $ 16.24 $ 5.26 28/06/2019 $ 16.24 $ 5.13 8 29/06/2019 $ 17.51 4.96 $ 21/11/2019 $ 250.72 $ 19.45 $ 22/11/2019 $ 223.41 $ 16.00 $ 23/11/2019 $ 221.31 $ 18.70 $ 24/11/2019 $ 251.50 $ 20.83 $ 25/11/2019 $ 231.12 $ 16.59 S 19.60 $ 20.58 30.51 $ 29.43 $ 141.72 :$ 146.34 $ 148.20 $ 164.87 S 172.64 $ 49.61 $ S 53. 1 5 54.155 20.41 $ 2115 5 21 49S .88 20.91 8 9 28.71 (4.52 74.62 5 70,37 9.46 5 10,48 5 11 80 S 7. 7.23 40.ES S 7-99 8.7 1 152.11 S 1,190, 1,191.95 1,358.52 6 1,353.05 $ | 11 13 1D 19 In Table 4 below you will find DAILY PRICE data for 10 stocks as well as for a Major Local Share Index (INDEX). Note: any future investment decisions will be made under the assumption that you can invest in any combination of the aforemention You also have access to an annual 6% borrowing/lending rate. Assume that a year has 12 months, 52 weeks, and 365 days. Calculate the Jensen's Alpha for STOCK 4 using the: Standard CAPM approach (using formulas). Regression approach. Aii. B What is the unsystematic risk component of STOCK 4? C. Discuss the results from Parts A and B? (e.g. Explain what the calculations mean? What action would you take as an inve (4-5 sentences. Point form is acceptable). FOR YOUR SOLUTION, PLEASE USE THE FIRST CELL OF YOUR ANSWER. D Is the Sharpe Ratio a reasonable way of assessing the performance of an asset? Briefly explain why or why not. (3-4 sentences. Point form is acceptable). FOR YOUR SOLUTION, PLEASE USE THE FIRST CELL OF YOUR ANSWER. Stock 3 Stock 4 Stock 5 Stock 7 Stock 6 10.58 $ T E2 = Table 4-Stock and Index Information Date Stock 1 Stock 2 26/06/2019 $ 16.12 $ 5.26 $ 27/06/2019 $ 16.24 $ 5.26 28/06/2019 $ 16.24 $ 5.13 8 29/06/2019 $ 17.51 4.96 $ 21/11/2019 $ 250.72 $ 19.45 $ 22/11/2019 $ 223.41 $ 16.00 $ 23/11/2019 $ 221.31 $ 18.70 $ 24/11/2019 $ 251.50 $ 20.83 $ 25/11/2019 $ 231.12 $ 16.59 S 19.60 $ 20.58 30.51 $ 29.43 $ 141.72 :$ 146.34 $ 148.20 $ 164.87 S 172.64 $ 49.61 $ S 53. 1 5 54.155 20.41 $ 2115 5 21 49S .88 20.91 8 9 28.71 (4.52 74.62 5 70,37 9.46 5 10,48 5 11 80 S 7. 7.23 40.ES S 7-99 8.7 1 152.11 S 1,190, 1,191.95 1,358.52 6 1,353.05 $ | 11 13 1D 19
Step by Step Solution
There are 3 Steps involved in it
Step: 1

Get Instant Access to Expert-Tailored Solutions
See step-by-step solutions with expert insights and AI powered tools for academic success
Step: 2

Step: 3
Ace Your Homework with AI
Get the answers you need in no time with our AI-driven, step-by-step assistance
Get Started
Dividend Policy On Share Price Volatility In Indian Stock Market
Authors: Vijay Deswal
1st Edition
3841859623, 978-3841859624