In the attached annual report there is a footnote on Pensions and Other Post Retirement Benefits. The assignment is to document what ASC topic reference is applicable to each area of the footnote. You will have to research in the Codification
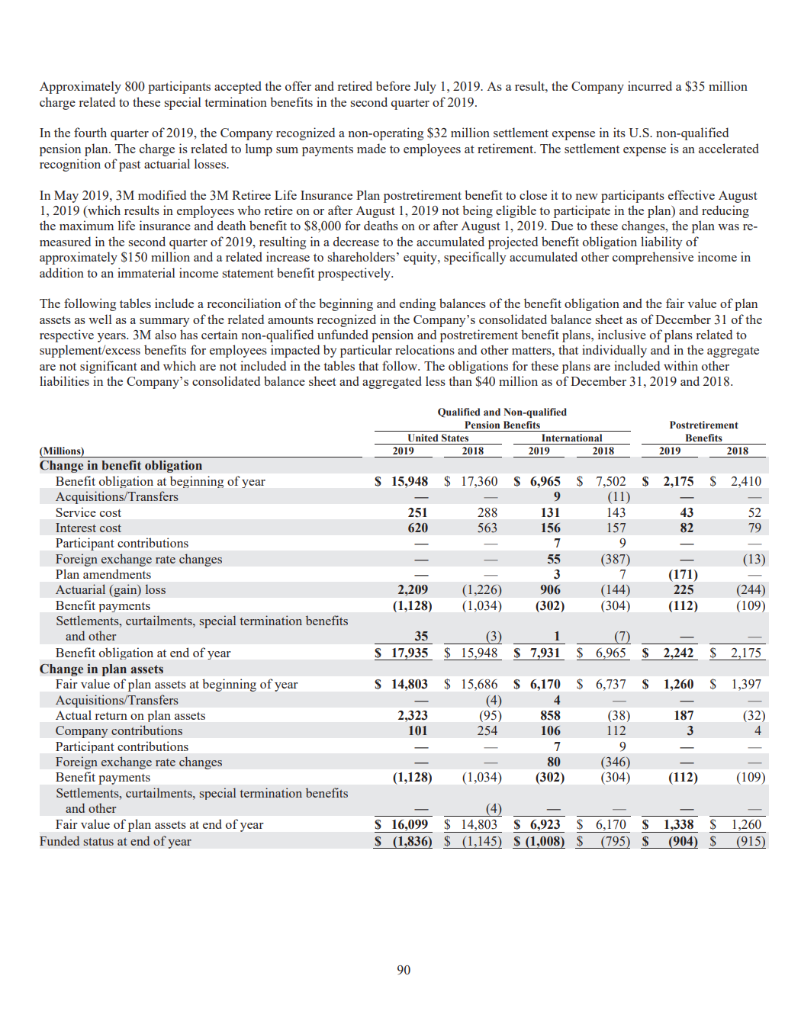
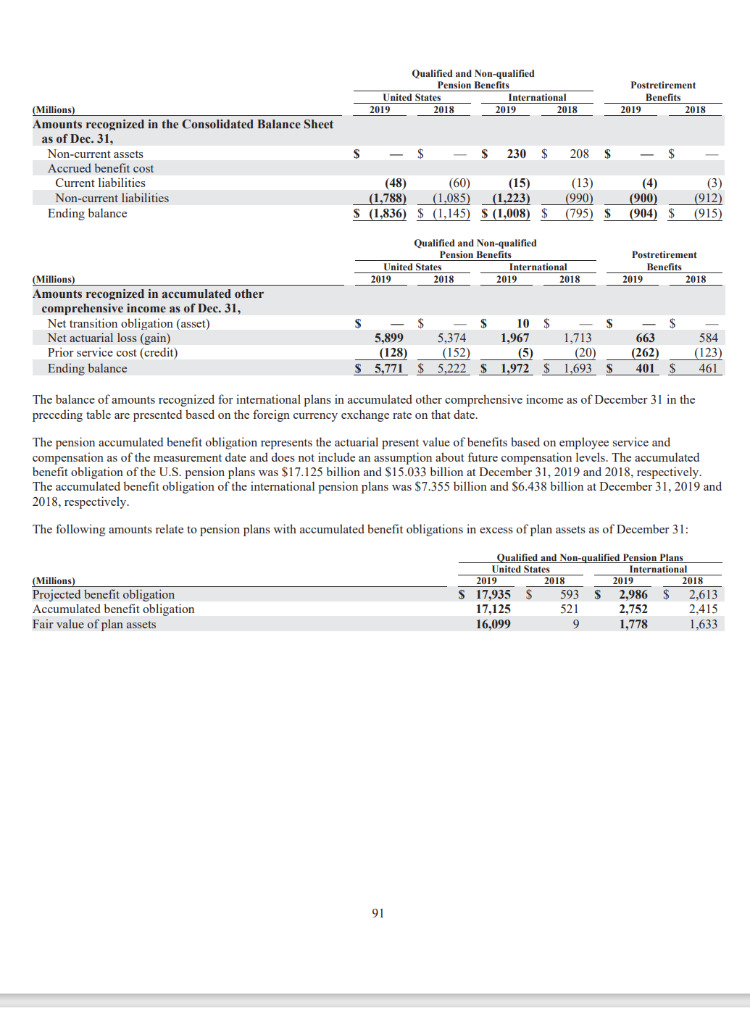
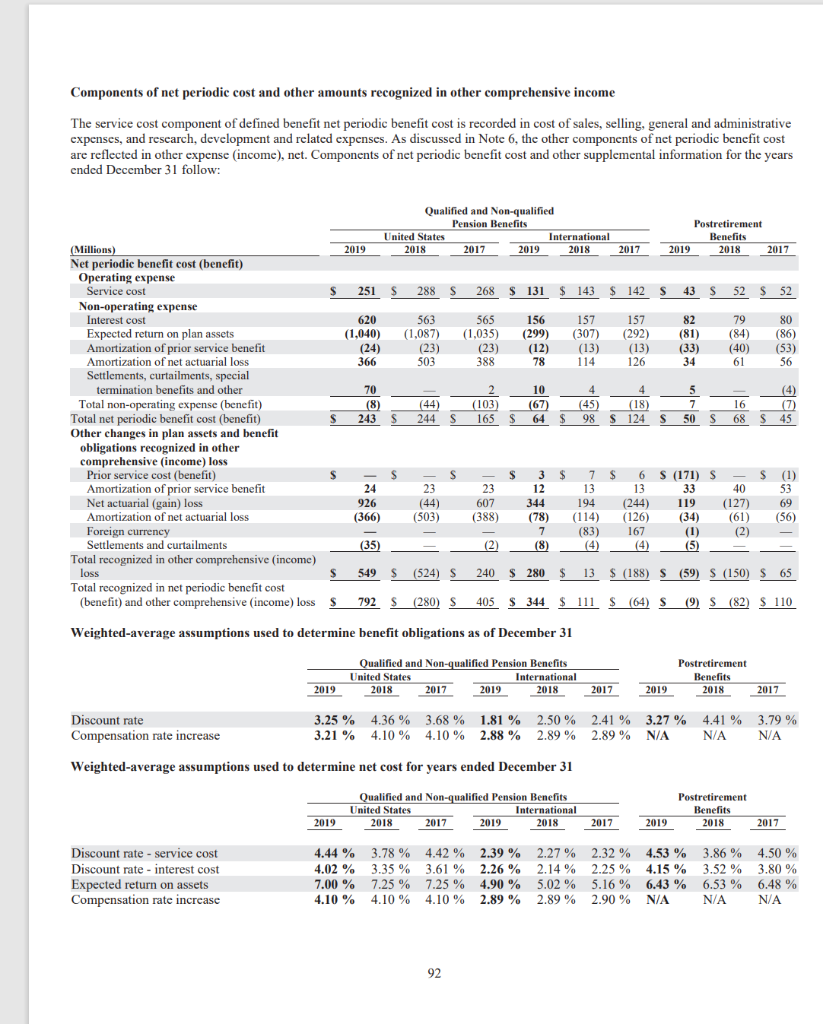
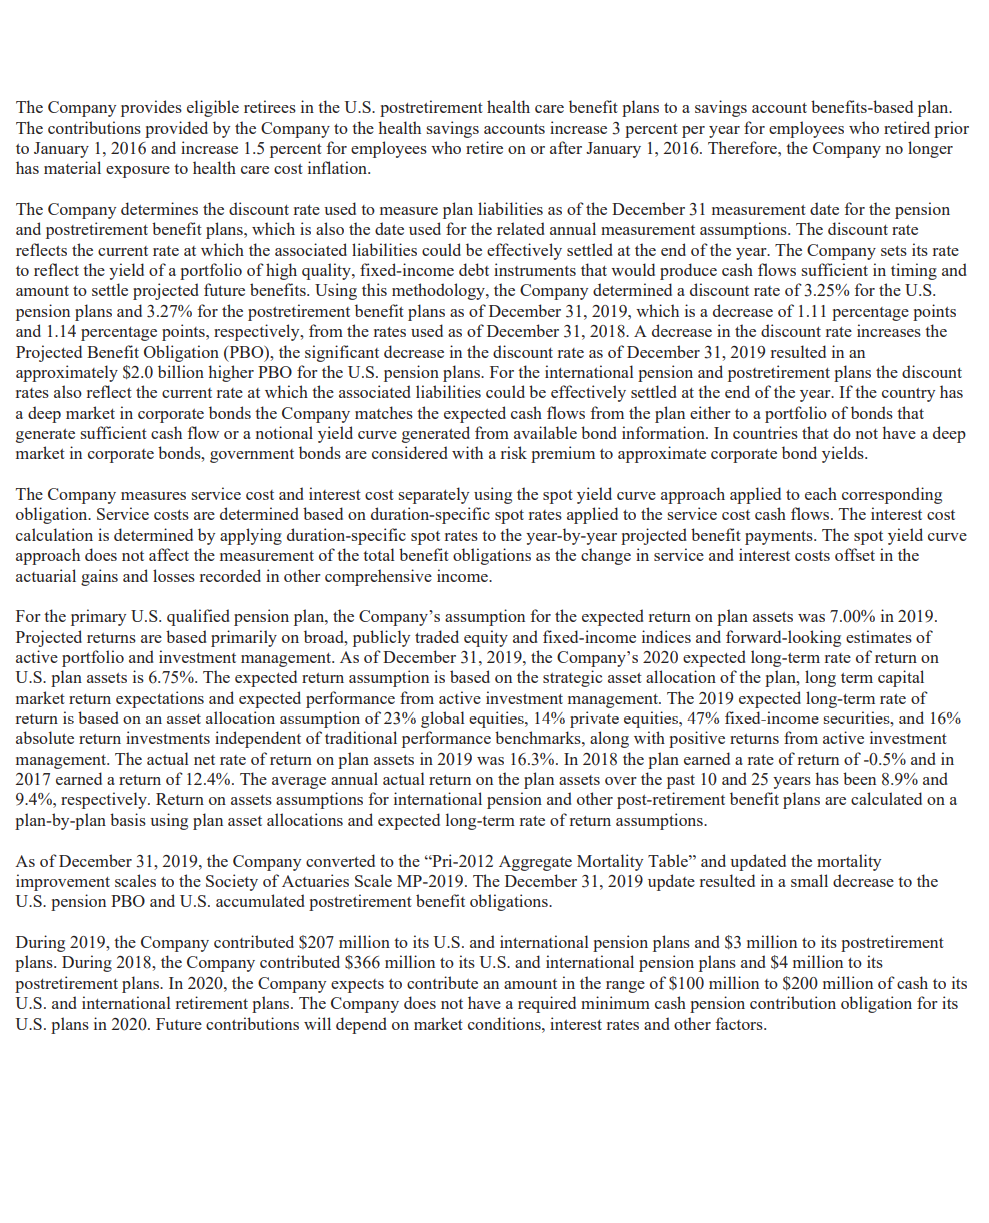
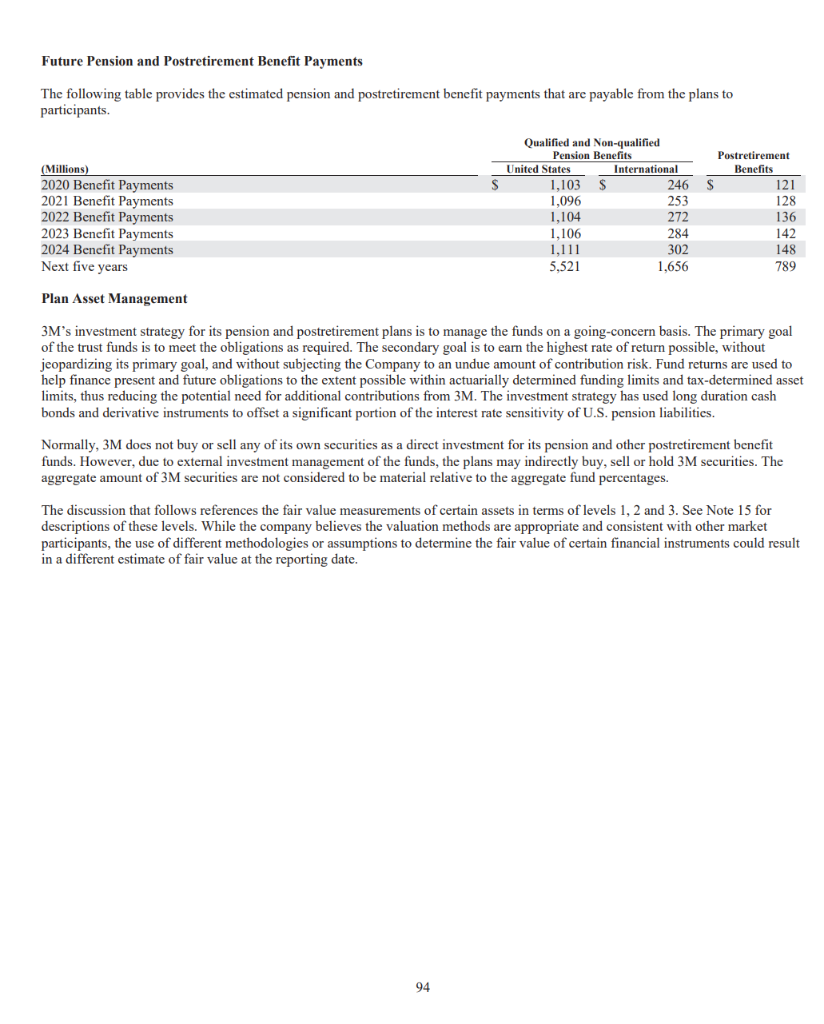
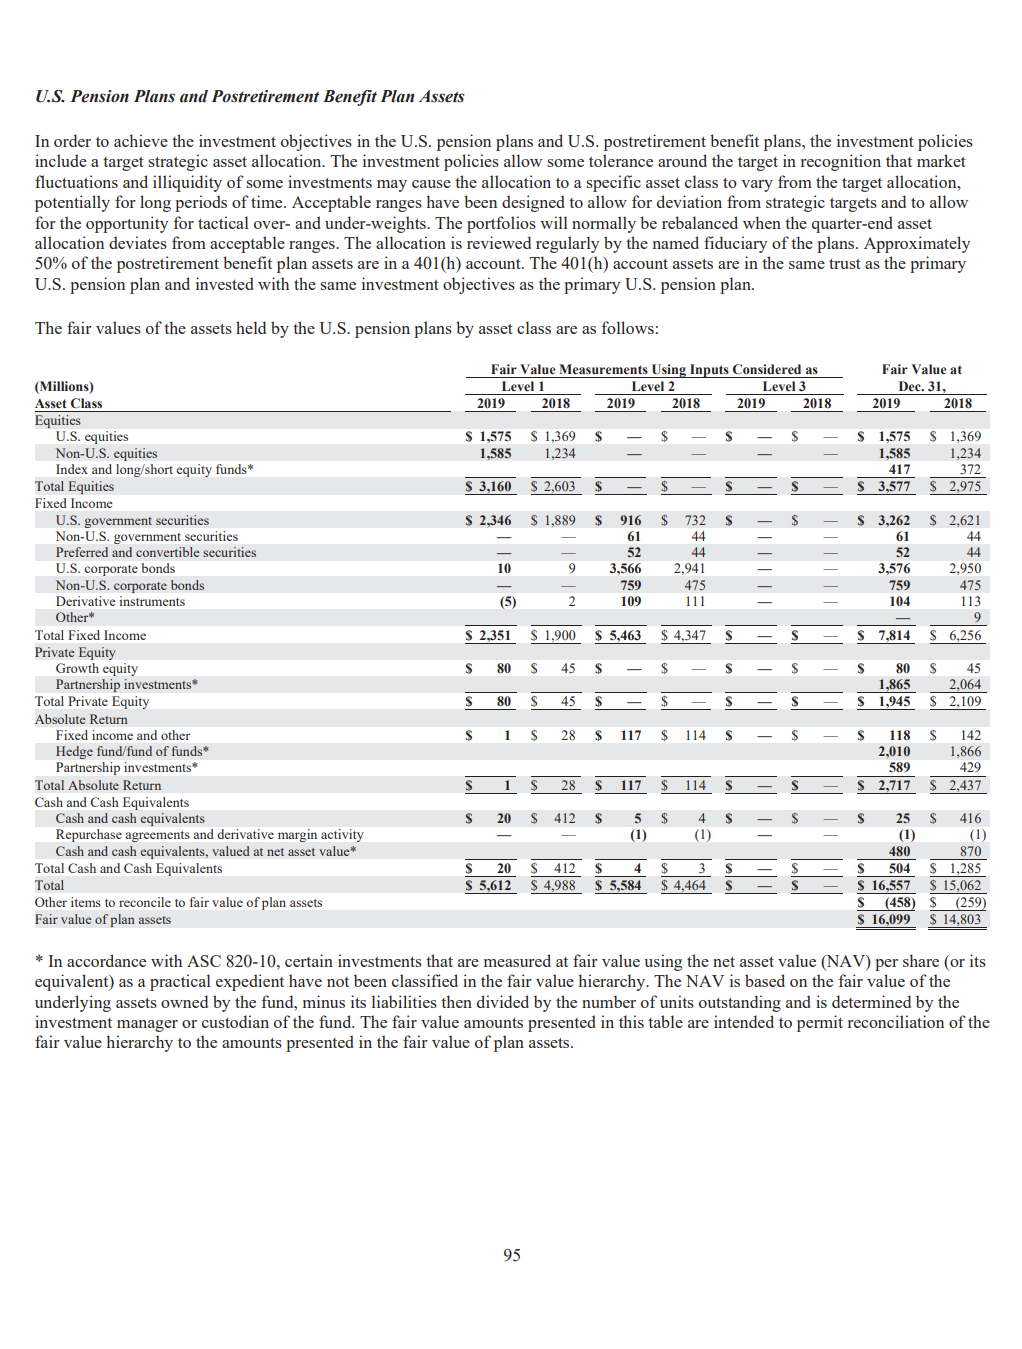
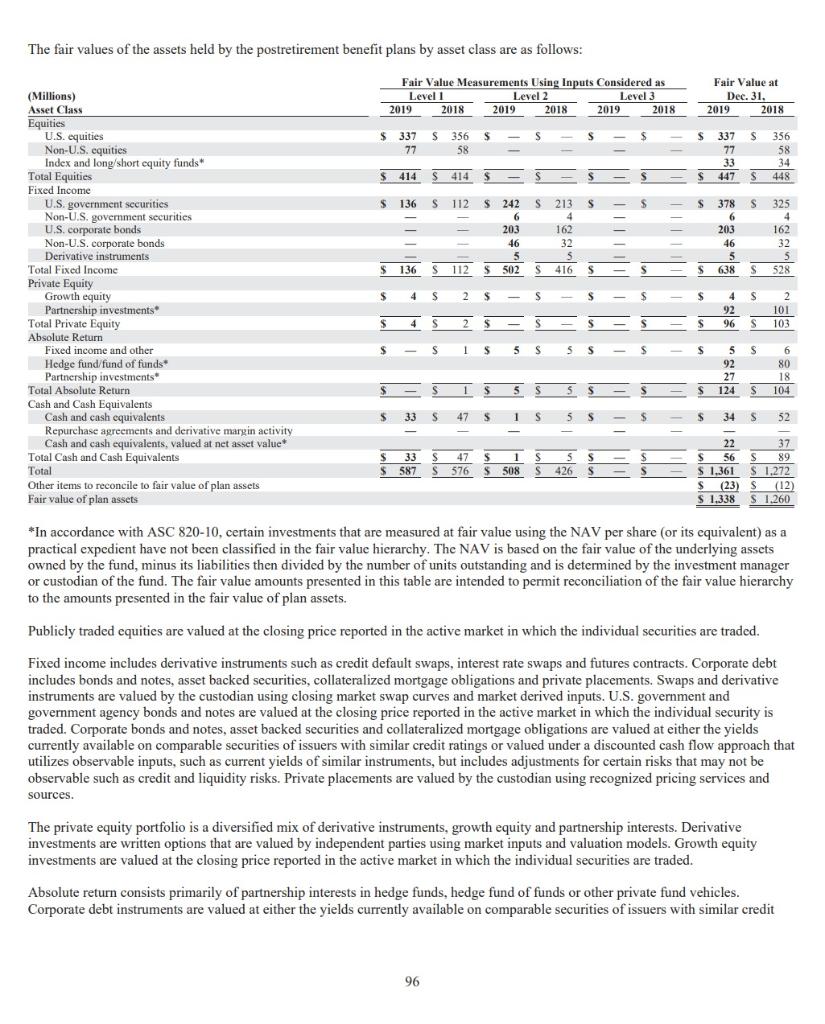
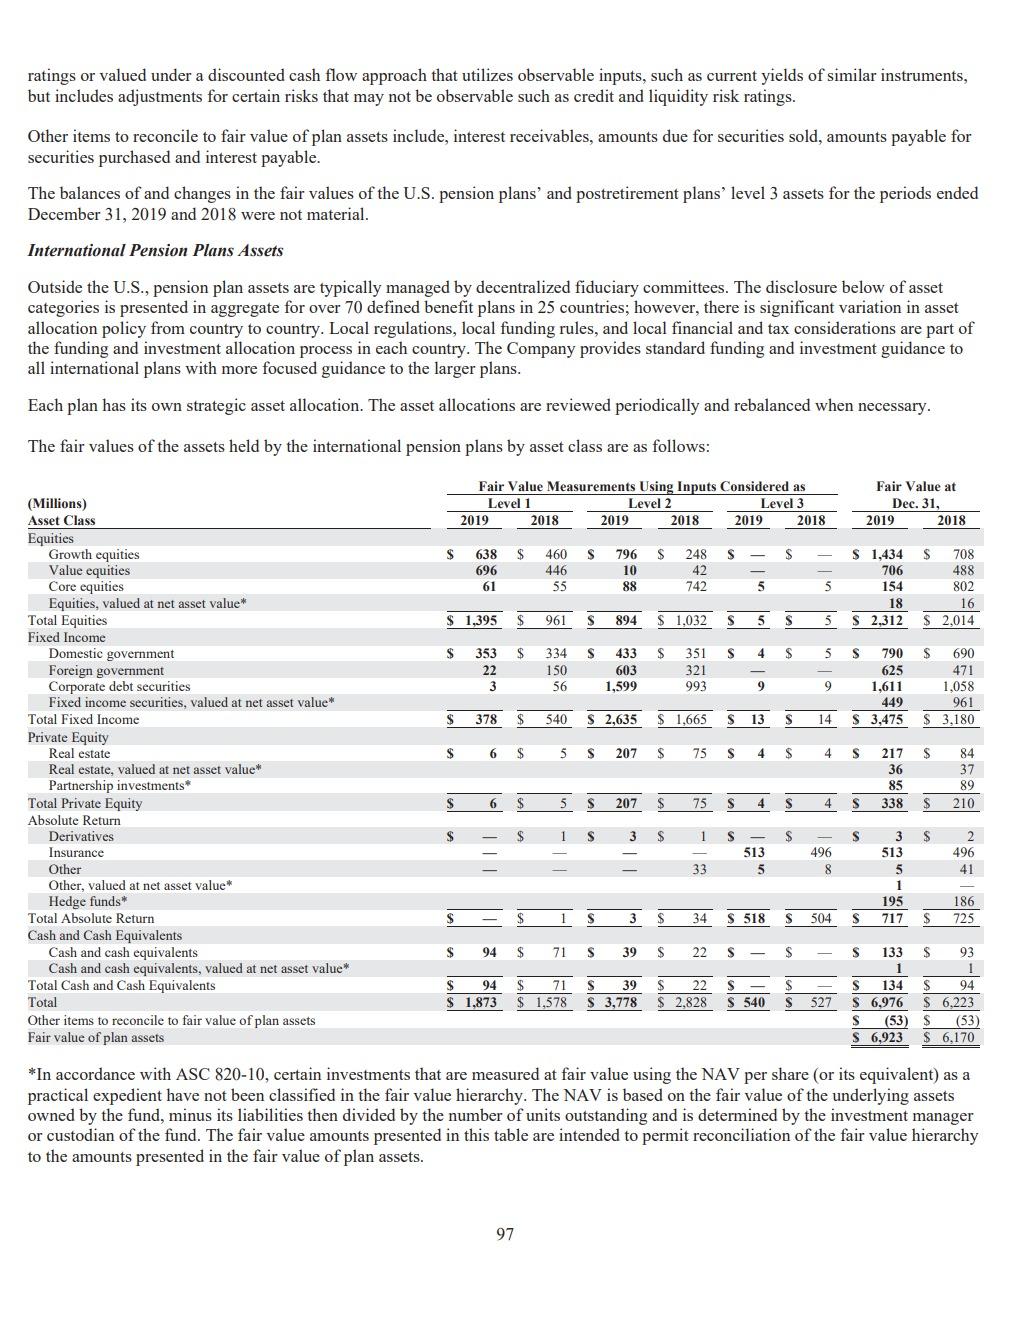
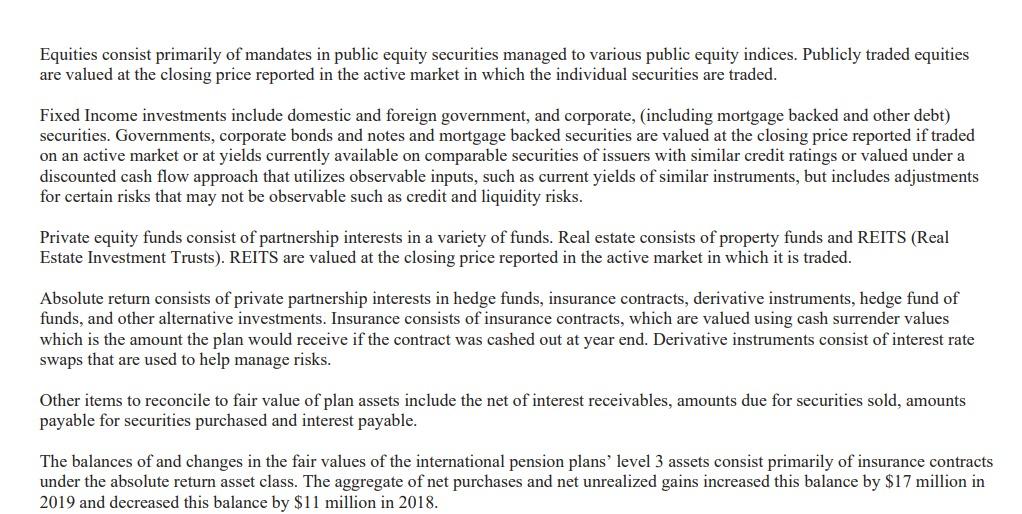
percent to 100 percent of par value. For the periods presented, 3M was required to repurchase an immaterial amount of principal on the aforementioned floating rate notes. NOTE 13. Pension and Postretirement Benefit Plans 3M has company-sponsored retirement plans covering substantially all U.S. employees and many employees outside the United States. In total, 3M has over 75 defined benefit plans in 28 countries. Pension benefits associated with these plans generally are based on each participant's years of service, compensation, and age at retirement or termination. The primary U.S. defined-benefit pension plan was closed to new participants effective January 1, 2009. The Company also provides certain postretirement health care and life insurance benefits for its U.S. employees who reach retirement age while employed by the Company and were employed by the Company prior to January 1, 2016. Most international employees and retirees are covered by government health care programs. The cost of company-provided postretirement health care plans for international employees is not material and is combined with U.S. amounts in the tables that follow. The Company has made deposits for its defined benefit plans with independent trustees. Trust funds and deposits with insurance companies are maintained to provide pension benefits to plan participants and their beneficiaries. There are no plan assets in the non- qualified plan due to its nature. For its U.S. postretirement health care and life insurance benefit plans, the Company has set aside amounts at least equal to annual benefit payments with an independent trustee. The Company also sponsors employee savings plans under Section 401(k) of the Internal Revenue Code. These plans are offered to substantially all regular U.S. employees. For eligible employees hired prior to January 1, 2009, employee 401(k) contributions of up to 5% of eligible compensation matched in cash at rates of 45% or 60%, depending on the plan in which the employee participates. Employees hired on or after January 1, 2009, receive a cash match of 100% for employee 401(k) contributions of up to 5% of eligible compensation and receive an employer retirement income account cash contribution of 3% of the participant's total eligible compensation. All contributions are invested in a number of investment funds pursuant to the employees' elections. Employer contributions to the U.S. defined contribution plans were $186 million, $173 million and $159 million for 2019, 2018 and 2017, respectively. 3M subsidiaries in various international countries also participate in defined contribution plans. Employer contributions to the international defined contribution plans were $96 million, $99 million and $88 million for 2019, 2018 and 2017, respectively. In May 2019 (as part of the 2019 restructuring actions discussed in Note 5), the Company began offering a voluntary early retirement incentive program to certain eligible participants of its U.S. pension plans who meet age and years of pension service requirements. The eligible participants who accepted the offer and retired by July 1, 2019 received an enhanced pension benefit. Pension benefits were enhanced by adding one additional year of pension service and one additional year of age for certain benefit calculations. 89 Approximately 800 participants accepted the offer and retired before July 1, 2019. As a result, the Company incurred a $35 million charge related to these special termination benefits in the second quarter of 2019. In the fourth quarter of 2019, the Company recognized a non-operating $32 million settlement expense in its U.S. non-qualified pension plan. The charge is related to lump sum payments made to employees at retirement. The settlement expense is an accelerated recognition of past actuarial losses. In May 2019, 3M modified the 3M Retiree Life Insurance Plan postretirement benefit to close it to new participants effective August 1, 2019 (which results in employees who retire on or after August 1, 2019 not being eligible to participate in the plan) and reducing the maximum life insurance and death benefit to $8,000 for deaths on or after August 1, 2019. Due to these changes, the plan was re- measured in the second quarter of 2019, resulting in a decrease to the accumulated projected benefit obligation liability of approximately S150 million and a related increase to shareholders' equity, specifically accumulated other comprehensive income in addition to an immaterial income statement benefit prospectively. The following tables include a reconciliation of the beginning and ending balances of the benefit obligation and the fair value of plan assets as well as a summary of the related amounts recognized in the Company's consolidated balance sheet as of December 31 of the respective years. 3M also has certain non-qualified unfunded pension and postretirement benefit plans, inclusive of plans related to supplement/excess benefits for employees impacted by particular relocations and other matters, that individually and in the aggregate are not significant and which are not included in the tables that follow. The obligations for these plans are included within other liabilities in the Company's consolidated balance sheet and aggregated less than $40 million as of December 31, 2019 and 2018. Qualified and Non-qualified Pension Benefits United States International 2019 2018 2019 2018 Postretirement Benefits 2019 2018 S 15,948 2,175 S 2,410 251 620 43 82 52 79 $ 17,360 S 6,965 $ 7,502 S 9 (11) 288 131 143 563 156 157 9 55 (387) 3 7 (1.226) 906 (144) (1,034) (304) (13) 2,209 (171) 225 (112) (244) (109) (1,128) (302) (Millions) Change in benefit obligation Benefit obligation at beginning of year Acquisitions/Transfers Service cost wees Interest cost Participant contributions Foreign exchange rate changes Plan amendments Actuarial (gain) loss Benefit payments Settlements, curtailments, special termination benefits and other Benefit obligation at end of year Change in plan assets Fair value of plan assets at beginning of year Acquisitions/Transfers Actual return on plan assets Company contributions Participant contributions Foreign exchange rate changes Benefit payments Settlements, curtailments, special termination benefits and other Fair value of plan assets at end of year Funded status at end of year 35 17,935 (3) 15.948 $ 7,931 (7 $ 6,965 $ 2,242 $ 2,175 S 14,803 S 6,737 S 1,260 S 1,397 2.323 101 15,686 S 6,170 (4) (95) 858 254 106 7 80 (1,034) (302) 187 3 (32) 4 (38) 112 9 (346) (304) (1,128) (112) (109) (4) S 16,099 $ 14,803 S 6,923 6,170 $ S (1,836) $ (1,145) S (1,008) S (795) $ 1,338 S (904) S 1.260 (915) 90 Qualified and Non-qualified Pension Benefits United States International 2019 2018 2019 2018 Postretirement Benefits 2019 2018 S $ 230 $ 208 $ $ (Millions) Amounts recognized in the Consolidated Balance Sheet as of Dec. 31, Non-current assets Accrued benefit cost Current liabilities Non-current liabilities Ending balance (48) (60) (15) (13) (4) (3) (1,788) (1.085) (1,223) (990) (900) (912) S (1,836) $ (1,145) S (1,008) $ (795) $ (904) $ (904) $ (915) Qualified and Non-qualified Pension Benefits United States International 2019 2018 2019 2018 Postretirement Benefits 2019 2018 (Millions) Amounts recognized in accumulated other comprehensive income as of Dec. 31, Net transition obligation (asset) Net actuarial loss (gain) Prior service cost credit) Ending balance S $ S 10 $ S 5,899 5,374 1,967 1,713 (128) (152) (5) (20) $ 5,771 $ 5,222 $ 1,972 $ 1,693 $ S 663 (262) 401 $ 584 (123) 461 The balance of amounts recognized for international plans in accumulated other comprehensive income as of December 31 in the preceding table are presented based on the foreign currency exchange rate on that date. The pension accumulated benefit obligation represents the actuarial present value of benefits based on employee service and compensation as of the measurement date and does not include an assumption about future compensation levels. The accumulated benefit obligation of the U.S. pension plans was $17.125 billion and $15.033 billion at December 31, 2019 and 2018, respectively. The accumulated benefit obligation of the international pension plans was $7.355 billion and $6.438 billion at December 31, 2019 and 2018, respectively. The following amounts relate to pension plans with accumulated benefit obligations in excess of plan assets as of December 31: (Millions) Projected benefit obligation Accumulated benefit obligation Fair value of plan assets Qualified and Non-qualified Pension Plans United States International 2019 2018 2019 2018 S 17,9355 593 S 2,986 $ 2,613 17,125 521 2,752 2.415 16,099 9 1,778 1,633 91 Components of net periodic cost and other amounts recognized in other comprehensive income The service cost component of defined benefit net periodic benefit cost is recorded in cost of sales, selling, general and administrative expenses, and research, development and related expenses. As discussed in Note 6, the other components of net periodic benefit cost are reflected in other expense (income), net. Components of net periodic benefit cost and other supplemental information for the years ended December 31 follow: S Qualified and Non-qualified Pension Benefits Postretirement United States International Benefits (Millions) 2019 2018 2017 2019 2018 2017 2019 2018 2017 Net periodic benefit cost (benefit) Operating expense Service cost S 251 $ 288 $ 268 $ 131 $ 143 142 $ 43 $ 52 $ 52 Non-operating expense Interest cost 620 563 565 156 157 157 82 79 80 Expected return on plan assets (1,040) (1,087) (1,035) ) (299) (307) (292) (81) (84) (86) ( Amortization of prior service benefit (24) (23) ( (23) (12) (13) (13) ) ( (33) (40) (53) Amortization of net actuarial loss 366 503 388 78 114 126 34 61 56 Settlements, curtailments, special termination benefits and other 70 2 10 4 4 4 5 (4) Total non-operating expense (benefit) (8) (44) (103) ( (67) (45) (18) 7 16 (7) Total net periodic benefit cost (benefit) 243 244 S 165 S 64 S 98 S 124 S 50 S 68 $ 45 Other changes in plan assets and benefit obligations recognized in other comprehensive (income) loss Prior service cost (benefit) S S 3 $ 7 s 6 S (171) S $ (1) Amortization of prior service benefit 24 23 23 12 13 13 33 40 53 Net actuarial (gain) loss 926 (44) 607 344 194 (244) 119 (127) 69 Amortization of net actuarial loss (366) (503) (388) (78) (114) (126) (34) ( (61) ( (56) Foreign currency 7 7 (83) 167 (1) (2) Settlements and curtailments (35) (2) 2 (8) (4) (4) 5 (5) Total recognized in other comprehensive (income) loss s 549 $ (524) 240 $ 280 $ 13 $ (188) S (59) S (150) S 65 Total recognized in net periodic benefit cost (benefit) and other comprehensive (income) loss $ 792 S (280) S 405 S 344 $ 111 $ (64) S (9) S (82) S 110 Weighted average assumptions used to determine benefit obligations as of December 31 Qualified and Non-qualified Pension Benefits United States International 2018 2017 2019 2018 Postretirement Benefits 2018 2019 2017 2019 2017 Discount rate 3.25 % 4.36% 3.68 % 1.81 % 2.50% 2.41 % 3.27 % 4.41 % 3.79 % Compensation rate increase 3.21% 4.10% 4.10% 2.88% 2.89% 2.89% N/A NA N/A NA Weighted average assumptions used to determine net cost for years ended December 31 Qualified and Non-qualified Pension Benefits United States International 2018 2017 2019 2018 2017 Postretirement Benefits 2018 2017 2019 2019 Discount rate - service cost Discount rate - interest cost Expected return on assets Compensation rate increase 4.44 % 3.78 % 4.42% 2.39% 2.27% 2.32% 2.39 % 2.27% 2.32 % 4.53% 3.86 % 4.50 % 4.02% 3.35% 3.61 % 3.61 % 2.26% 2.26% 2.14% 2.14% 2.25 % 4.15 % 3.52 % 3.80 % % 7.00 % 7.25% 7.25% 4.90 % 5.02% 5.16% 6.43 % % 6.53 % 6.48 % % 4.10 % 4.10 % 4.10 % 2.89 % 2.89 % 2.89 % 2.90 % N/A /A N/A N/A 92 The Company provides eligible retirees in the U.S. postretirement health care benefit plans to a savings account benefits-based plan. The contributions provided by the Company to the health savings accounts increase 3 percent per year for employees who retired prior to January 1, 2016 and increase 1.5 percent for employees who retire on or after January 1, 2016. Therefore, the Company no longer has material exposure to health care cost inflation. The Company determines the discount rate used to measure plan liabilities as of the December 31 measurement date for the pension and postretirement benefit plans, which is also the date used for the related annual measurement assumptions. The discount rate reflects the current rate at which the associated liabilities could be effectively settled at the end of the year. The Company sets its rate to reflect the yield of a portfolio of high quality, fixed-income debt instruments that would produce cash flows sufficient in timing and amount to settle projected future benefits. Using this methodology, the Company determined a discount rate of 3.25% for the U.S. pension plans and 3.27% for the postretirement benefit plans as of December 31, 2019, which is a decrease of 1.11 percentage points and 1.14 percentage points, respectively, from the rates used as of December 31, 2018. A decrease in the discount rate increases the Projected Benefit Obligation (PBO), the significant decrease in the discount rate as of December 31, 2019 resulted in an approximately $2.0 billion higher PBO for the U.S. pension plans. For the international pension and postretirement plans the discount rates also reflect the current rate at which the associated liabilities could be effectively settled at the end of the year. If the country has a deep market in corporate bonds the Company matches the expected cash flows from the plan either to a portfolio of bonds that generate sufficient cash flow or a notional yield curve generated from available bond information. In countries that do not have a deep market in corporate bonds, government bonds are considered with a risk premium to approximate corporate bond yields. The Company measures service cost and interest cost separately using the spot yield curve approach applied to each corresponding obligation. Service costs are determined based on duration-specific spot rates applied to the service cost cash flows. The interest cost calculation is determined by applying duration-specific spot rates to the year-by-year projected benefit payments. The spot yield curve approach does not affect the measurement of the total benefit obligations as the change in service and interest costs offset in the actuarial gains and losses recorded in other comprehensive income. For the primary U.S. qualified pension plan, the Company's assumption for the expected return on plan assets was 7.00% in 2019. Projected returns are based primarily on broad, publicly traded equity and fixed-income indices and forward-looking estimates of active portfolio and investment management. As of December 31, 2019, the Company's 2020 expected long-term rate of return on U.S. plan assets is 6.75%. The expected return assumption is based on the strategic asset allocation of the plan, long term capital market return expectations and expected performance from active investment management. The 2019 expected long-term rate of return is based on an asset allocation assumption of 23% global equities, 14% private equities, 47% fixed-income securities, and 16% absolute return investments independent of traditional performance benchmarks, along with positive returns from active investment management. The actual net rate of return on plan assets in 2019 was 16.3%. In 2018 the plan earned a rate of return of -0.5% and in 2017 earned a return of 12.4%. The average annual actual return on the plan assets over the past 10 and 25 years has been 8.9% and 9.4%, respectively. Return on assets assumptions for international pension and other post-retirement benefit plans are calculated on a plan-by-plan basis using plan asset allocations and expected long-term rate of return assumptions. As of December 31, 2019, the Company converted to the "Pri-2012 Aggregate Mortality Table and updated the mortality improvement scales to the Society of Actuaries Scale MP-2019. The December 31, 2019 update resulted in a small decrease to the U.S. pension PBO and U.S. accumulated postretirement benefit obligations. During 2019, the Company contributed $207 million to its U.S. and international pension plans and $3 million to its postretirement plans. During 2018, the Company contributed $366 million to its U.S. and international pension plans and $4 million to postretirement plans. In 2020, the Company expects to contribute an amount in the range of $100 million to $200 million of cash to its U.S. and international retirement plans. The Company does not have a required minimum cash pension contribution obligation for its U.S. plans in 2020. Future contributions will depend on market conditions, interest rates and other factors. Future Pension and Postretirement Benefit Payments The following table provides the estimated pension and postretirement benefit payments that are payable from the plans to participants. (Millions) 2020 Benefit Payments 2021 Benefit Payments 2022 Benefit Payments 2023 Benefit Payments 2024 Benefit Payments Next five years Qualified and Non-qualified Pension Benefits United States International 1,1035 246 1,096 253 1,104 272 1,106 284 302 5,521 1,656 Postretirement Benefits S 121 128 136 142 148 789 1,111 Plan Asset Management 3M's investment strategy for its pension and postretirement plans is to manage the funds on a going-concern basis. The primary goal of the trust funds is to meet the obligations as required. The secondary goal is to earn the highest rate of return possible, without jeopardizing its primary goal, and without subjecting the Company to an undue amount of contribution risk. Fund returns are used to help finance present and future obligations to the extent possible within actuarially determined funding limits and tax-determined asset limits, thus reducing the potential need for additional contributions from 3M. The investment strategy has used long duration cash bonds and derivative instruments to offset a significant portion of the interest rate sensitivity of U.S. pension liabilities. Normally, 3M does not buy or sell any of its own securities as a direct investment for its pension and other postretirement benefit funds. However, due to external investment management of the funds, the plans may indirectly buy, sell or hold 3M securities. The aggregate amount of 3M securities are not considered to be material relative to the aggregate fund percentages. The discussion that follows references the fair value measurements of certain assets in terms of levels 1, 2 and 3. See Note 15 for descriptions of these levels. While the company believes the valuation methods are appropriate and consistent with other market participants, the use of different methodologies or assumptions to determine the fair value of certain financial instruments could result in a different estimate of fair value at the reporting date. 94 U.S. Pension Plans and Postretirement Benefit Plan Assets In order to achieve the investment objectives in the U.S. pension plans and U.S. postretirement benefit plans, the investment policies include a target strategic asset allocation. The investment policies allow some tolerance around the target in recognition that market fluctuations and illiquidity of some investments may cause the allocation to a specific asset class to vary from the target allocation, potentially for long periods of time. Acceptable ranges have been designed to allow for deviation from strategic targets and to allow for the opportunity for tactical over- and under-weights. The portfolios will normally be rebalanced when the quarter-end asset allocation deviates from acceptable ranges. The allocation is reviewed regularly by the named fiduciary of the plans. Approximately 50% of the postretirement benefit plan assets are in a 401(h) account. The 401(h) account assets are in the same trust as the primary U.S. pension plan and invested with the same investment objectives as the primary U.S. pension plan. The fair values of the assets held by the U.S. pension plans by asset class are as follows: Fair Value Measurements Using Inputs Considered as Level 1 Level 2 Level 3 2019 2018 2019 2018 2019 2018 Fair Value at Dec. 31, 2018 2019 $ S S 1,575 $ 1,369 $ 1,585 1,234 $ 1,575 $ 1,369 1,585 1,234 417 372 S 3,577 $ 2,975 S 3,160 $ 2,603 $ S 52 S 2,346 $ 1,889 $ 916 61 52 10 9 3,566 759 (5) (5 2 109 $ 732 44 44 2,941 475 111 $ 3,262 $ 2,621 61 44 44 3,576 2.950 759 475 104 113 9 $ 7,814 $ 6,256 $ 2,351 $ 1,900 $ 5,463 $ 4,347 S S (Millions) Asset Class Equities U.S. equities Non-U.S. equities Index and long/short equity funds Total Equities Fixed Income U.S. government securities Non-U.S. government securities Preferred and convertible securities U.S. corporate bonds Non-U.S. corporate bonds Derivative instruments Other* Total Fixed Income Private Equity Growth equity Partnership investments* Total Private Equity Absolute Return Fixed income and other Hedge fund/fund of funds* Partnership investments* Total Absolute Return Cash and Cash Equivalents Cash and cash equivalents Repurchase agreements and derivative margin activity Cash and cash equivalents, valued at net asset value Total Cash and Cash Equivalents Total Other items to reconcile to fair value of plan assets Fair value of plan assets 80 45 $ S S 80 $ 45 1,865 2,064 $ - $ 1,945 $ 2,109 S 80 S 45 $ S S 1 S $ 28 S 117 $ 114 S 118 $ 142 2,010 1,866 589 429 $ 2,717 $ 2,437 1 S 28 $ 117 $ 114 S 20 S 412 $ $ S S 5 ( (1) 4 (1) s 20 S 5,612 S 412 $ 4,988 $ 4 $ 5,584 $ 3 $ 4,464 S S 25 S 416 (1) (1) 480 870 504 $ 1,285 $ 16,557 $ 15,062 S (458) $ (259) $ 16,099 $ 14,803 * In accordance with ASC 820-10, certain investments that are measured at fair value using the net asset value (NAV) per share (or its equivalent) as a practical expedient have not been classified in the fair value hierarchy. The NAV is based on the fair value of the underlying assets owned by the fund, minus its liabilities then divided by the number of units outstanding and is determined by the investment manager or custodian of the fund. The fair value amounts presented in this table are intended to permit reconciliation of the fair value hierarchy to the amounts presented in the fair value of plan assets. 95 The fair values of the assets held by the postretirement benefit plans by asset class are as follows: Fair Value Measurements Using Inputs Considered as Level 1 Level 2 Level 3 2019 2018 2019 2018 2019 2018 Fair Value at Dec. 31, 2019 2018 $ $ 337 77 $ 356 58 $ 337 77 33 $ 447 356 58 34 $ 414 5 414 $ S 448 S 136 S 112 213 S S S $ 242 S 6 203 46 5 $ 502 S 162 32 5 416 378 6 203 46 5 638 325 4 162 32 S 528 $ 136 S 112 S (Millions) Asset Class Equities U.S. equities Non-U.S. equities Index and long/short equity funds Total Equities Fixed Income U.S. government securities Non-U.S. government securities U.S. corporate bonds Non-U.S. corporate bonds Derivative instruments Total Fixed Income Private Equity Growth equity Partnership investments Total Private Equity Absolute Return Fixed income and other Hedge fund/fund of funds Partnership investments Total Absolute Return Cash and Cash Equivalents Cash and cash equivalents Repurchase agreements and derivative margin activity Cash and cash equivalents, valued at net asset value* Total Cash and Cash Equivalents Total Other items to reconcile to fair value of plan assets Fair value of plan assets 4 S 2 S S S s 4 92 96 S 2 101 S 103 4 S 2 2 $ - S $ $ S 1 S 5 S S S 5 5 S S G 92 80 27 18 124 S S 104 S 1 $5 S $5 5 S - $ S 33 S 47 $ 1 s $ 33 $ 587 s 47 S 576 S 1 $ 508 S S 5 426 E S 34 52 - - 22 37 $ 56 s 89 $ 1.361 $ 1.272 $ S (23) (23) S (12) $ 1.338 $ 1.260 S *In accordance with ASC 820-10, certain investments that are measured at fair value using the NAV per share (or its equivalent) as a practical expedient have not been classified in the fair value hierarchy. The NAV is based on the fair value of the underlying assets owned by the fund, minus its liabilities then divided by the number of units outstanding and is determined by the investment manager or custodian of the fund. The fair value amounts presented in this table are intended to permit reconciliation of the fair value hierarchy to the amounts presented in the fair value of plan assets. Publicly traded equities are valued at the closing price reported in the active market in which the individual securities are traded. Fixed income includes derivative instruments such as credit default swaps, interest rate swaps and futures contracts. Corporate debt includes bonds and notes, asset backed securities, collateralized mortgage obligations and private placements. Swaps and derivative instruments are valued by the custodian using closing market swap curves and market derived inputs. U.S. government and government agency bonds and notes are valued at the closing price reported in the active market in which the individual security is traded. Corporate bonds and notes, asset backed securities and collateralized mortgage obligations are valued at either the yields currently available on comparable securities of issuers with similar credit ratings or valued under a discounted cash flow approach that utilizes observable inputs, such as current yields of similar instruments, but includes adjustments for certain risks that may not be observable such as credit and liquidity risks. Private placements are valued by the custodian using recognized pricing services and sources. The private equity portfolio is a diversified mix of derivative instruments, growth equity and partnership interests. Derivative investments are written options that are valued by independent parties using market inputs and valuation models. Growth equity investments are valued at the closing price reported in the active market in which the individual securities are traded. Absolute return consists primarily of partnership interests in hedge funds, hedge fund of funds or other private fund vehicles. Corporate debt instruments are valued at either the yields currently available on comparable securities of issuers with similar credit 96 ratings or valued under a discounted cash flow approach that utilizes observable inputs, such as current yields of similar instruments, but includes adjustments for certain risks that may not be observable such as credit and liquidity risk ratings. Other items to reconcile to fair value of plan assets include, interest receivables, amounts due for securities sold, amounts payable for securities purchased and interest payable. The balances of and changes in the fair values of the U.S. pension plans and postretirement plans' level 3 assets for the periods ended December 31, 2019 and 2018 were not material. International Pension Plans Assets Outside the U.S., pension plan assets are typically managed by decentralized fiduciary committees. The disclosure below of asset categories is presented in aggregate for over 70 defined benefit plans in 25 countries; however, there is significant variation in asset allocation policy from country to country. Local regulations, local funding rules, and local financial and tax considerations are part of the funding and investment allocation process in each country. The Company provides standard funding and investment guidance to all international plans with more focused guidance to the larger plans. Each plan has its own strategic asset allocation. The asset allocations are reviewed periodically and rebalanced when necessary. The fair values of the assets held by the international pension plans by asset class are as follows: Fair Value Measurements Using Inputs Considered as Level 1 Level 2 Level 3 2019 2018 2019 2018 2019 2018 Fair Value at Dec. 31, 2019 2018 $ $ $ $ S $ 638 696 61 460 S 446 55 796 10 88 248 42 742 5 5 $ 1,434 $ 708 706 488 154 802 18 16 $ 2,312 $2,014 $ 1,395 $ 961 S 894 $ 1,032 S 5 $ 5 $ S S $ S 4 S 353 22 3 334 150 56 433 603 1,599 351 321 993 9 5 S 790 625 9 1,611 449 14 S 3,475 S 690 471 1,058 961 $ 3,180 S 378 $ 540 $ 2,635 $ 1,665 $ 1,65 S 13 S S 6 $ 5 S 207 S 75 S 4 $ 4 S $ (Millions) Asset Class Equities Growth equities Value equities Core equities Equities, valued at net asset value* Total Equities Fixed Income Domestic government Foreign government Corporate debt securities Fixed income securities, valued at net asset value* Total Fixed Income Private Equity Real estate Real estate, valued at net asset value* Partnership investments* Total Private Equity Absolute Return Derivatives Insurance Other Other, valued at net asset value* Hedge funds Total Absolute Return Cash and Cash Equivalents Cash and cash equivalents Cash and cash equivalents, valued at net asset value* Total Cash and Cash Equivalents Total Other items to reconcile to fair value of plan assets Fair value of plan assets 217 36 85 338 84 37 89 210 6 5 S 207 75 S 4 4 4 S $ 3 $ 1 1 S $ S | 1 | 513 5 496 8 8 33 3 $ 2 513 496 5 41 1 195 186 717 $ 725 $ S 1 S 3 3 $ 34 S 518 S 504 $ $ 94 $ 71 S 39 $ 22 S $ $ 94 $ 1,873 S 71 $ 1,578 S 39 $ 22 S 3,778 $ 2,828 S S 540 $ $ 527 S 133 $ 93 1 1 S 134 $ 94 S 6,976 $ 6,223 S (53) $ (53) $ 6,923 $ 6,170 *In accordance with ASC 820-10, certain investments that are measured at fair value using the NAV per share (or its equivalent) as a practical expedient have not been classified in the fair value hierarchy. The NAV is based on the fair value of the underlying assets owned by the fund, minus its liabilities then divided by the number of units outstanding and is determined by the investment manager or custodian of the fund. The fair value amounts presented in this table are intended to permit reconciliation of the fair value hierarchy to the amounts presented in the fair value of plan assets. 97 Equities consist primarily of mandates in public equity securities managed to various public equity indices. Publicly traded equities are valued at the closing price reported in the active market in which the individual securities are traded. Fixed Income investments include domestic and foreign government, and corporate, (including mortgage backed and other debt) securities. Governments, corporate bonds and notes and mortgage backed securities are valued at the closing price reported if traded on an active market or at yields currently available on comparable securities of issuers with similar credit ratings or valued under a discounted cash flow approach that utilizes observable inputs, such as current yields of similar instruments, but includes adjustments for certain risks that may not be observable such as credit and liquidity risks. Private equity funds consist of partnership interests in a variety of funds. Real estate consists of property funds and REITS (Real Estate Investment Trusts). REITS are valued at the closing price reported in the active market in which it is traded. Absolute return consists of private partnership interests in hedge funds, insurance contracts, derivative instruments, hedge fund of funds, and other alternative investments. Insurance consists of insurance contracts, which are valued using cash surrender values which is the amount the plan would receive if the contract was cashed out at year end. Derivative instruments consist of interest rate swaps that are used to help manage risks. Other items to reconcile to fair value of plan assets include the net of interest receivables, amounts due for securities sold, amounts payable for securities purchased and interest payable. The balances of and chang in the fair values of the international pension plans' level 3 assets consist primarily of insurance contracts under the absolute return asset class. The aggregate of net purchases and net unrealized gains increased this balance by $17 million in 2019 and decreased this balance by $11 million in 2018. percent to 100 percent of par value. For the periods presented, 3M was required to repurchase an immaterial amount of principal on the aforementioned floating rate notes. NOTE 13. Pension and Postretirement Benefit Plans 3M has company-sponsored retirement plans covering substantially all U.S. employees and many employees outside the United States. In total, 3M has over 75 defined benefit plans in 28 countries. Pension benefits associated with these plans generally are based on each participant's years of service, compensation, and age at retirement or termination. The primary U.S. defined-benefit pension plan was closed to new participants effective January 1, 2009. The Company also provides certain postretirement health care and life insurance benefits for its U.S. employees who reach retirement age while employed by the Company and were employed by the Company prior to January 1, 2016. Most international employees and retirees are covered by government health care programs. The cost of company-provided postretirement health care plans for international employees is not material and is combined with U.S. amounts in the tables that follow. The Company has made deposits for its defined benefit plans with independent trustees. Trust funds and deposits with insurance companies are maintained to provide pension benefits to plan participants and their beneficiaries. There are no plan assets in the non- qualified plan due to its nature. For its U.S. postretirement health care and life insurance benefit plans, the Company has set aside amounts at least equal to annual benefit payments with an independent trustee. The Company also sponsors employee savings plans under Section 401(k) of the Internal Revenue Code. These plans are offered to substantially all regular U.S. employees. For eligible employees hired prior to January 1, 2009, employee 401(k) contributions of up to 5% of eligible compensation matched in cash at rates of 45% or 60%, depending on the plan in which the employee participates. Employees hired on or after January 1, 2009, receive a cash match of 100% for employee 401(k) contributions of up to 5% of eligible compensation and receive an employer retirement income account cash contribution of 3% of the participant's total eligible compensation. All contributions are invested in a number of investment funds pursuant to the employees' elections. Employer contributions to the U.S. defined contribution plans were $186 million, $173 million and $159 million for 2019, 2018 and 2017, respectively. 3M subsidiaries in various international countries also participate in defined contribution plans. Employer contributions to the international defined contribution plans were $96 million, $99 million and $88 million for 2019, 2018 and 2017, respectively. In May 2019 (as part of the 2019 restructuring actions discussed in Note 5), the Company began offering a voluntary early retirement incentive program to certain eligible participants of its U.S. pension plans who meet age and years of pension service requirements. The eligible participants who accepted the offer and retired by July 1, 2019 received an enhanced pension benefit. Pension benefits were enhanced by adding one additional year of pension service and one additional year of age for certain benefit calculations. 89 Approximately 800 participants accepted the offer and retired before July 1, 2019. As a result, the Company incurred a $35 million charge related to these special termination benefits in the second quarter of 2019. In the fourth quarter of 2019, the Company recognized a non-operating $32 million settlement expense in its U.S. non-qualified pension plan. The charge is related to lump sum payments made to employees at retirement. The settlement expense is an accelerated recognition of past actuarial losses. In May 2019, 3M modified the 3M Retiree Life Insurance Plan postretirement benefit to close it to new participants effective August 1, 2019 (which results in employees who retire on or after August 1, 2019 not being eligible to participate in the plan) and reducing the maximum life insurance and death benefit to $8,000 for deaths on or after August 1, 2019. Due to these changes, the plan was re- measured in the second quarter of 2019, resulting in a decrease to the accumulated projected benefit obligation liability of approximately S150 million and a related increase to shareholders' equity, specifically accumulated other comprehensive income in addition to an immaterial income statement benefit prospectively. The following tables include a reconciliation of the beginning and ending balances of the benefit obligation and the fair value of plan assets as well as a summary of the related amounts recognized in the Company's consolidated balance sheet as of December 31 of the respective years. 3M also has certain non-qualified unfunded pension and postretirement benefit plans, inclusive of plans related to supplement/excess benefits for employees impacted by particular relocations and other matters, that individually and in the aggregate are not significant and which are not included in the tables that follow. The obligations for these plans are included within other liabilities in the Company's consolidated balance sheet and aggregated less than $40 million as of December 31, 2019 and 2018. Qualified and Non-qualified Pension Benefits United States International 2019 2018 2019 2018 Postretirement Benefits 2019 2018 S 15,948 2,175 S 2,410 251 620 43 82 52 79 $ 17,360 S 6,965 $ 7,502 S 9 (11) 288 131 143 563 156 157 9 55 (387) 3 7 (1.226) 906 (144) (1,034) (304) (13) 2,209 (171) 225 (112) (244) (109) (1,128) (302) (Millions) Change in benefit obligation Benefit obligation at beginning of year Acquisitions/Transfers Service cost wees Interest cost Participant contributions Foreign exchange rate changes Plan amendments Actuarial (gain) loss Benefit payments Settlements, curtailments, special termination benefits and other Benefit obligation at end of year Change in plan assets Fair value of plan assets at beginning of year Acquisitions/Transfers Actual return on plan assets Company contributions Participant contributions Foreign exchange rate changes Benefit payments Settlements, curtailments, special termination benefits and other Fair value of plan assets at end of year Funded status at end of year 35 17,935 (3) 15.948 $ 7,931 (7 $ 6,965 $ 2,242 $ 2,175 S 14,803 S 6,737 S 1,260 S 1,397 2.323 101 15,686 S 6,170 (4) (95) 858 254 106 7 80 (1,034) (302) 187 3 (32) 4 (38) 112 9 (346) (304) (1,128) (112) (109) (4) S 16,099 $ 14,803 S 6,923 6,170 $ S (1,836) $ (1,145) S (1,008) S (795) $ 1,338 S (904) S 1.260 (915) 90 Qualified and Non-qualified Pension Benefits United States International 2019 2018 2019 2018 Postretirement Benefits 2019 2018 S $ 230 $ 208 $ $ (Millions) Amounts recognized in the Consolidated Balance Sheet as of Dec. 31, Non-current assets Accrued benefit cost Current liabilities Non-current liabilities Ending balance (48) (60) (15) (13) (4) (3) (1,788) (1.085) (1,223) (990) (900) (912) S (1,836) $ (1,145) S (1,008) $ (795) $ (904) $ (904) $ (915) Qualified and Non-qualified Pension Benefits United States International 2019 2018 2019 2018 Postretirement Benefits 2019 2018 (Millions) Amounts recognized in accumulated other comprehensive income as of Dec. 31, Net transition obligation (asset) Net actuarial loss (gain) Prior service cost credit) Ending balance S $ S 10 $ S 5,899 5,374 1,967 1,713 (128) (152) (5) (20) $ 5,771 $ 5,222 $ 1,972 $ 1,693 $ S 663 (262) 401 $ 584 (123) 461 The balance of amounts recognized for international plans in accumulated other comprehensive income as of December 31 in the preceding table are presented based on the foreign currency exchange rate on that date. The pension accumulated benefit obligation represents the actuarial present value of benefits based on employee service and compensation as of the measurement date and does not include an assumption about future compensation levels. The accumulated benefit obligation of the U.S. pension plans was $17.125 billion and $15.033 billion at December 31, 2019 and 2018, respectively. The accumulated benefit obligation of the international pension plans was $7.355 billion and $6.438 billion at December 31, 2019 and 2018, respectively. The following amounts relate to pension plans with accumulated benefit obligations in excess of plan assets as of December 31: (Millions) Projected benefit obligation Accumulated benefit obligation Fair value of plan assets Qualified and Non-qualified Pension Plans United States International 2019 2018 2019 2018 S 17,9355 593 S 2,986 $ 2,613 17,125 521 2,752 2.415 16,099 9 1,778 1,633 91 Components of net periodic cost and other amounts recognized in other comprehensive income The service cost component of defined benefit net periodic benefit cost is recorded in cost of sales, selling, general and administrative expenses, and research, development and related expenses. As discussed in Note 6, the other components of net periodic benefit cost are reflected in other expense (income), net. Components of net periodic benefit cost and other supplemental information for the years ended December 31 follow: S Qualified and Non-qualified Pension Benefits Postretirement United States International Benefits (Millions) 2019 2018 2017 2019 2018 2017 2019 2018 2017 Net periodic benefit cost (benefit) Operating expense Service cost S 251 $ 288 $ 268 $ 131 $ 143 142 $ 43 $ 52 $ 52 Non-operating expense Interest cost 620 563 565 156 157 157 82 79 80 Expected return on plan assets (1,040) (1,087) (1,035) ) (299) (307) (292) (81) (84) (86) ( Amortization of prior service benefit (24) (23) ( (23) (12) (13) (13) ) ( (33) (40) (53) Amortization of net actuarial loss 366 503 388 78 114 126 34 61 56 Settlements, curtailments, special termination benefits and other 70 2 10 4 4 4 5 (4) Total non-operating expense (benefit) (8) (44) (103) ( (67) (45) (18) 7 16 (7) Total net periodic benefit cost (benefit) 243 244 S 165 S 64 S 98 S 124 S 50 S 68 $ 45 Other changes in plan assets and benefit obligations recognized in other comprehensive (income) loss Prior service cost (benefit) S S 3 $ 7 s 6 S (171) S $ (1) Amortization of prior service benefit 24 23 23 12 13 13 33 40 53 Net actuarial (gain) loss 926 (44) 607 344 194 (244) 119 (127) 69 Amortization of net actuarial loss (366) (503) (388) (78) (114) (126) (34) ( (61) ( (56) Foreign currency 7 7 (83) 167 (1) (2) Settlements and curtailments (35) (2) 2 (8) (4) (4) 5 (5) Total recognized in other comprehensive (income) loss s 549 $ (524) 240 $ 280 $ 13 $ (188) S (59) S (150) S 65 Total recognized in net periodic benefit cost (benefit) and other comprehensive (income) loss $ 792 S (280) S 405 S 344 $ 111 $ (64) S (9) S (82) S 110 Weighted average assumptions used to determine benefit obligations as of December 31 Qualified and Non-qualified Pension Benefits United States International 2018 2017 2019 2018 Postretirement Benefits 2018 2019 2017 2019 2017 Discount rate 3.25 % 4.36% 3.68 % 1.81 % 2.50% 2.41 % 3.27 % 4.41 % 3.79 % Compensation rate increase 3.21% 4.10% 4.10% 2.88% 2.89% 2.89% N/A NA N/A NA Weighted average assumptions used to determine net cost for years ended December 31 Qualified and Non-qualified Pension Benefits United States International 2018 2017 2019 2018 2017 Postretirement Benefits 2018 2017 2019 2019 Discount rate - service cost Discount rate - interest cost Expected return on assets Compensation rate increase 4.44 % 3.78 % 4.42% 2.39% 2.27% 2.32% 2.39 % 2.27% 2.32 % 4.53% 3.86 % 4.50 % 4.02% 3.35% 3.61 % 3.61 % 2.26% 2.26% 2.14% 2.14% 2.25 % 4.15 % 3.52 % 3.80 % % 7.00 % 7.25% 7.25% 4.90 % 5.02% 5.16% 6.43 % % 6.53 % 6.48 % % 4.10 % 4.10 % 4.10 % 2.89 % 2.89 % 2.89 % 2.90 % N/A /A N/A N/A 92 The Company provides eligible retirees in the U.S. postretirement health care benefit plans to a savings account benefits-based plan. The contributions provided by the Company to the health savings accounts increase 3 percent per year for employees who retired prior to January 1, 2016 and increase 1.5 percent for employees who retire on or after January 1, 2016. Therefore, the Company no longer has material exposure to health care cost inflation. The Company determines the discount rate used to measure plan liabilities as of the December 31 measurement date for the pension and postretirement benefit plans, which is also the date used for the related annual measurement assumptions. The discount rate reflects the current rate at which the associated liabilities could be effectively settled at the end of the year. The Company sets its rate to reflect the yield of a portfolio of high quality, fixed-income debt instruments that would produce cash flows sufficient in timing and amount to settle projected future benefits. Using this methodology, the Company determined a discount rate of 3.25% for the U.S. pension plans and 3.27% for the postretirement benefit plans as of December 31, 2019, which is a decrease of 1.11 percentage points and 1.14 percentage points, respectively, from the rates used as of December 31, 2018. A decrease in the discount rate increases the Projected Benefit Obligation (PBO), the significant decrease in the discount rate as of December 31, 2019 resulted in an approximately $2.0 billion higher PBO for the U.S. pension plans. For the international pension and postretirement plans the discount rates also reflect the current rate at which the associated liabilities could be effectively settled at the end of the year. If the country has a deep market in corporate bonds the Company matches the expected cash flows from the plan either to a portfolio of bonds that generate sufficient cash flow or a notional yield curve generated from available bond information. In countries that do not have a deep market in corporate bonds, government bonds are considered with a risk premium to approximate corporate bond yields. The Company measures service cost and interest cost separately using the spot yield curve approach applied to each corresponding obligation. Service costs are determined based on duration-specific spot rates applied to the service cost cash flows. The interest cost calculation is determined by applying duration-specific spot rates to the year-by-year projected benefit payments. The spot yield curve approach does not affect the measurement of the total benefit obligations as the change in service and interest costs offset in the actuarial gains and losses recorded in other comprehensive income. For the primary U.S. qualified pension plan, the Company's assumption for the expected return on plan assets was 7.00% in 2019. Projected returns are based primarily on broad, publicly traded equity and fixed-income indices and forward-looking estimates of active portfolio and investment management. As of December 31, 2019, the Company's 2020 expected long-term rate of return on U.S. plan assets is 6.75%. The expected return assumption is based on the strategic asset allocation of the plan, long term capital market return expectations and expected performance from active investment management. The 2019 expected long-term rate of return is based on an asset allocation assumption of 23% global equities, 14% private equities, 47% fixed-income securities, and 16% absolute return investments independent of traditional performance benchmarks, along with positive returns from active investment management. The actual net rate of return on plan assets in 2019 was 16.3%. In 2018 the plan earned a rate of return of -0.5% and in 2017 earned a return of 12.4%. The average annual actual return on the plan assets over the past 10 and 25 years has been 8.9% and 9.4%, respectively. Return on assets assumptions for international pension and other post-retirement benefit plans are calculated on a plan-by-plan basis using plan asset allocations and expected long-term rate of return assumptions. As of December 31, 2019, the Company converted to the "Pri-2012 Aggregate Mortality Table and updated the mortality improvement scales to the Society of Actuaries Scale MP-2019. The December 31, 2019 update resulted in a small decrease to the U.S. pension PBO and U.S. accumulated postretirement benefit obligations. During 2019, the Company contributed $207 million to its U.S. and international pension plans and $3 million to its postretirement plans. During 2018, the Company contributed $366 million to its U.S. and international pension plans and $4 million to postretirement plans. In 2020, the Company expects to contribute an amount in the range of $100 million to $200 million of cash to its U.S. and international retirement plans. The Company does not have a required minimum cash pension contribution obligation for its U.S. plans in 2020. Future contributions will depend on market conditions, interest rates and other factors. Future Pension and Postretirement Benefit Payments The following table provides the estimated pension and postretirement benefit payments that are payable from the plans to participants. (Millions) 2020 Benefit Payments 2021 Benefit Payments 2022 Benefit Payments 2023 Benefit Payments 2024 Benefit Payments Next five years Qualified and Non-qualified Pension Benefits United States International 1,1035 246 1,096 253 1,104 272 1,106 284 302 5,521 1,656 Postretirement Benefits S 121 128 136 142 148 789 1,111 Plan Asset Management 3M's investment strategy for its pension and postretirement plans is to manage the funds on a going-concern basis. The primary goal of the trust funds is to meet the obligations as required. The secondary goal is to earn the highest rate of return possible, without jeopardizing its primary goal, and without subjecting the Company to an undue amount of contribution risk. Fund returns are used to help finance present and future obligations to the extent possible within actuarially determined funding limits and tax-determined asset limits, thus reducing the potential need for additional contributions from 3M. The investment strategy has used long duration cash bonds and derivative instruments to offset a significant portion of the interest rate sensitivity of U.S. pension liabilities. Normally, 3M does not buy or sell any of its own securities as a direct investment for its pension and other postretirement benefit funds. However, due to external investment management of the funds, the plans may indirectly buy, sell or hold 3M securities. The aggregate amount of 3M securities are not considered to be material relative to the aggregate fund percentages. The discussion that follows references the fair value measurements of certain assets in terms of levels 1, 2 and 3. See Note 15 for descriptions of these levels. While the company believes the valuation methods are appropriate and consistent with other market participants, the use of different methodologies or assumptions to determine the fair value of certain financial instruments could result in a different estimate of fair value at the reporting date. 94 U.S. Pension Plans and Postretirement Benefit Plan Assets In order to achieve the investment objectives in the U.S. pension plans and U.S. postretirement benefit plans, the investment policies include a target strategic asset allocation. The investment policies allow some tolerance around the target in recognition that market fluctuations and illiquidity of some investments may cause the allocation to a specific asset class to vary from the target allocation, potentially for long periods of time. Acceptable ranges have been designed to allow for deviation from strategic targets and to allow for the opportunity for tactical over- and under-weights. The portfolios will normally be rebalanced when the quarter-end asset allocation deviates from acceptable ranges. The allocation is reviewed regularly by the named fiduciary of the plans. Approximately 50% of the postretirement benefit plan assets are in a 401(h) account. The 401(h) account assets are in the same trust as the primary U.S. pension plan and invested with the same investment objectives as the primary U.S. pension plan. The fair values of the assets held by the U.S. pension plans by asset class are as follows: Fair Value Measurements Using Inputs Considered as Level 1 Level 2 Level 3 2019 2018 2019 2018 2019 2018 Fair Value at Dec. 31, 2018 2019 $ S S 1,575 $ 1,369 $ 1,585 1,234 $ 1,575 $ 1,369 1,585 1,234 417 372 S 3,577 $ 2,975 S 3,160 $ 2,603 $ S 52 S 2,346 $ 1,889 $ 916 61 52 10 9 3,566 759 (5) (5 2 109 $ 732 44 44 2,941 475 111 $ 3,262 $ 2,621 61 44 44 3,576 2.950 759 475 104 113 9 $ 7,814 $ 6,256 $ 2,351 $ 1,900 $ 5,463 $ 4,347 S S (Millions) Asset Class Equities U.S. equities Non-U.S. equities Index and long/short equity funds Total Equities Fixed Income U.S. government securities Non-U.S. government securities Preferred and convertible securities U.S. corporate bonds Non-U.S. corporate bonds Derivative instruments Other* Total Fixed Income Private Equity Growth equity Partnership investments* Total Private Equity Absolute Return Fixed income and other Hedge fund/fund of funds* Partnership investments* Total Absolute Return Cash and Cash Equivalents Cash and cash equivalents Repurchase agreements and derivative margin activity Cash and cash equivalents, valued at net asset value Total Cash and Cash Equivalents Total Other items to reconcile to fair value of plan assets Fair value of plan assets 80 45 $ S S 80 $ 45 1,865 2,064 $ - $ 1,945 $ 2,109 S 80 S 45 $ S S 1 S $ 28 S 117 $ 114 S 118 $ 142 2,010 1,866 589 429 $ 2,717 $ 2,437 1 S 28 $ 117 $ 114 S 20 S 412 $ $ S S 5 ( (1) 4 (1) s 20 S 5,612 S 412 $ 4,988 $ 4 $ 5,584 $ 3 $ 4,464 S S 25 S 416 (1) (1) 480 870 504 $ 1,285 $ 16,557 $ 15,062 S (458) $ (259) $ 16,099 $ 14,803 * In accordance with ASC 820-10, certain investments that are measured at fair value using the net asset value (NAV) per share (or its equivalent) as a practical expedient have not been classified in the fair value hierarchy. The NAV is based on the fair value of the underlying assets owned by the fund, minus its liabilities then divided by the number of units outstanding and is determined by the investment manager or custodian of the fund. The fair value amounts presented in this table are intended to permit reconciliation of the fair value hierarchy to the amounts presented in the fair value of plan assets. 95 The fair values of the assets held by the postretirement benefit plans by asset class are as follows: Fair Value Measurements Using Inputs Considered as Level 1 Level 2 Level 3 2019 2018 2019 2018 2019 2018 Fair Value at Dec. 31, 2019 2018 $ $ 337 77 $ 356 58 $ 337 77 33 $ 447 356 58 34 $ 414 5 414 $ S 448 S 136 S 112 213 S S S $ 242 S 6 203 46 5 $ 502 S 162 32 5 416 378 6 203 46 5 638 325 4 162 32 S 528 $ 136 S 112 S (Millions) Asset Class Equities U.S. equities Non-U.S. equities Index and long/short equity funds Total Equities Fixed Income U.S. government securities Non-U.S. government securities U.S. corporate bonds Non-U.S. corporate bonds Derivative instruments Total Fixed Income Private Equity Growth equity Partnership investments Total Private Equity Absolute Return Fixed income and other Hedge fund/fund of funds Partnership investments Total Absolute Return Cash and Cash Equivalents Cash and cash equivalents Repurchase agreements and derivative margin activity Cash and cash equivalents, valued at net asset value* Total Cash and Cash Equivalents Total Other items to reconcile to fair value of plan assets Fair value of plan assets 4 S 2 S S S s 4 92 96 S 2 101 S 103 4 S 2 2 $ - S $ $ S 1 S 5 S S S 5 5 S S G 92 80 27 18 124 S S 104 S 1 $5 S $5 5 S - $ S 33 S 47 $ 1 s $ 33 $ 587 s 47 S 576 S 1 $ 508 S S 5 426 E S 34 52 - - 22 37 $ 56 s 89 $ 1.361 $ 1.272 $ S (23) (23) S (12) $ 1.338 $ 1.260 S *In accordance with ASC 820-10, certain investments that are measured at fair value using the NAV per share (or its equivalent) as a practical expedient have not been classified in the fair value hierarchy. The NAV is based on the fair value of the underlying assets owned by the fund, minus its liabilities then divided by the number of units outstanding and is determined by the investment manager or custodian of the fund. The fair value amounts presented in this table are intended to permit reconciliation of the fair value hierarchy to the amounts presented in the fair value of plan assets. Publicly traded equities are valued at the closing price reported in the active market in which the individual securities are traded. Fixed income includes derivative instruments such as credit default swaps, interest rate swaps and futures contracts. Corporate debt includes bonds and notes, asset backed securities, collateralized mortgage obligations and private placements. Swaps and derivative instruments are valued by the custodian using closing market swap curves and market derived inputs. U.S. government and government agency bonds and notes are valued at the closing price reported in the active market in which the individual security is traded. Corporate bonds and notes, asset backed securities and collateralized mortgage obligations are valued at either the yields currently available on comparable securities of issuers with similar credit ratings or valued under a discounted cash flow approach that utilizes observable inputs, such as current yields of similar instruments, but includes adjustments for certain risks that may not be observable such as credit and liquidity risks. Private placements are valued by the custodian using recognized pricing services and sources. The private equity portfolio is a diversified mix of derivative instruments, growth equity and partnership interests. Derivative investments are written options that are valued by independent parties using market inputs and valuation models. Growth equity investments are valued at the closing price reported in the active market in which the individual securities are traded. Absolute return consists primarily of partnership interests in hedge funds, hedge fund of funds or other private fund vehicles. Corporate debt instruments are valued at either the yields currently available on comparable securities of issuers with similar credit 96 ratings or valued under a discounted cash flow approach that utilizes observable inputs, such as current yields of similar instruments, but includes adjustments for certain risks that may not be observable such as credit and liquidity risk ratings. Other items to reconcile to fair value of plan assets include, interest receivables, amounts due for securities sold, amounts payable for securities purchased and interest payable. The balances of and changes in the fair values of the U.S. pension plans and postretirement plans' level 3 assets for the periods ended December 31, 2019 and 2018 were not material. International Pension Plans Assets Outside the U.S., pension plan assets are typically managed by decentralized fiduciary committees. The disclosure below of asset categories is presented in aggregate for over 70 defined benefit plans in 25 countries; however, there is significant variation in asset allocation policy from country to country. Local regulations, local funding rules, and local financial and tax considerations are part of the funding and investment allocation process in each country. The Company provides standard funding and investment guidance to all international plans with more focused guidance to the larger plans. Each plan has its own strategic asset allocation. The asset allocations are reviewed periodically and rebalanced when necessary. The fair values of the assets held by the international pension plans by asset class are as follows: Fair Value Measurements Using Inputs Considered as Level 1 Level 2 Level 3 2019 2018 2019 2018 2019 2018 Fair Value at Dec. 31, 2019 2018 $ $ $ $ S $ 638 696 61 460 S 446 55 796 10 88 248 42 742 5 5 $ 1,434 $ 708 706 488 154 802 18 16 $ 2,312 $2,014 $ 1,395 $ 961 S 894 $ 1,032 S 5 $ 5 $ S S $ S 4 S 353 22 3 334 150 56 433 603 1,599 351 321 993 9 5 S 790 625 9 1,611 449 14 S 3,475 S 690 471 1,058 961 $ 3,180 S 378 $ 540 $ 2,635 $ 1,665 $ 1,65 S 13 S S 6 $ 5 S 207 S 75 S 4 $ 4 S $ (Millions) Asset Class Equities Growth equities Value equities Core equities Equities, valued at net asset value* Total Equities Fixed Income Domestic government Foreign government Corporate debt securities Fixed income securities, valued at net asset value* Total Fixed Income Private Equity Real estate Real estate, valued at net asset value* Partnership investments* Total Private Equity Absolute Return Derivatives Insurance Other Other, valued at net asset value* Hedge funds Total Absolute Return Cash and Cash Equivalents Cash and cash equivalents Cash and cash equivalents, valued at net asset value* Total Cash and Cash Equivalents Total Other items to reconcile to fair value of plan assets Fair value of plan assets 217 36 85 338 84 37 89 210 6 5 S 207 75 S 4 4 4 S $ 3 $ 1 1 S $ S | 1 | 513 5 496 8 8 33 3 $ 2 513 496 5 41 1 195 186 717 $ 725 $ S 1 S 3 3 $ 34 S 518 S 504 $ $ 94 $ 71 S 39 $ 22 S $ $ 94 $ 1,873 S 71 $ 1,578 S 39 $ 22 S 3,778 $ 2,828 S S 540 $ $ 527 S 133 $ 93 1 1 S 134 $ 94 S 6,976 $ 6,223 S (53) $ (53) $ 6,923 $ 6,170 *In accordance with ASC 820-10, certain investments that are measured at fair value using the NAV per share (or its equivalent) as a practical expedient have not been classified in the fair value hierarchy. The NAV is based on the fair value of the underlying assets owned by the fund, minus its liabilities then divided by the number of units outstanding and is determined by the investment manager or custodian of the fund. The fair value amounts presented in this table are intended to permit reconciliation of the fair value hierarchy to the amounts presented in the fair value of plan assets. 97 Equities consist primarily of mandates in public equity securities managed to various public equity indices. Publicly traded equities are valued at the closing price reported in the active market in which the individual securities are traded. Fixed Income investments include domestic and foreign government, and corporate, (including mortgage backed and other debt) securities. Governments, corporate bonds and notes and mortgage backed securities are valued at the closing price reported if traded on an active market or at yields currently available on comparable securities of issuers with similar credit ratings or valued under a discounted cash flow approach that utilizes observable inputs, such as current yields of similar instruments, but includes adjustments for certain risks that may not be observable such as credit and liquidity risks. Private equity funds consist of partnership interests in a variety of funds. Real estate consists of property funds and REITS (Real Estate Investment Trusts). REITS are valued at the closing price reported in the active market in which it is traded. Absolute return consists of private partnership interests in hedge funds, insurance contracts, derivative instruments, hedge fund of funds, and other alternative investments. Insurance consists of insurance contracts, which are valued using cash surrender values which is the amount the plan would receive if the contract was cashed out at year end. Deriv