Answered step by step
Verified Expert Solution
Question
1 Approved Answer
In the Florida plant, Angela McCormack, who holds engineering and MBA degrees, oversees a 15-member quality assurance staff. They watch all aspects of quality,


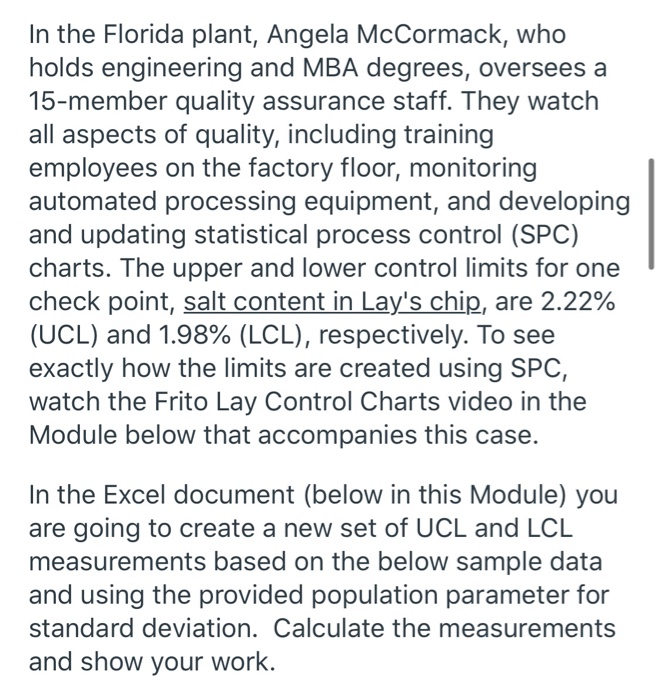
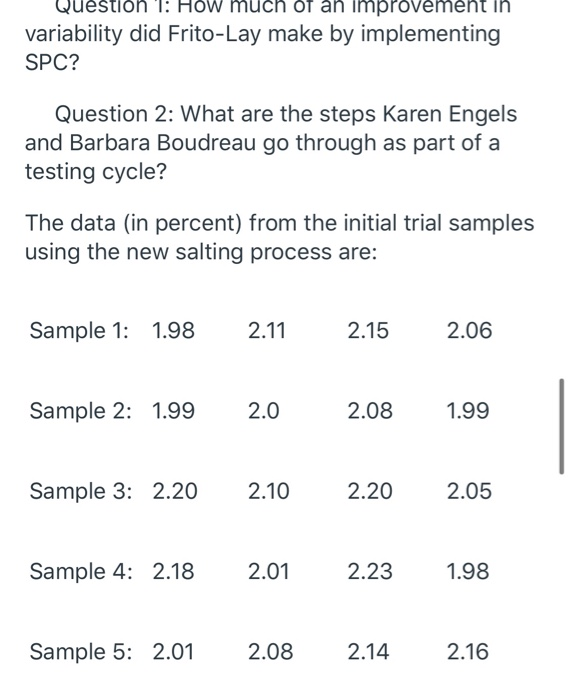
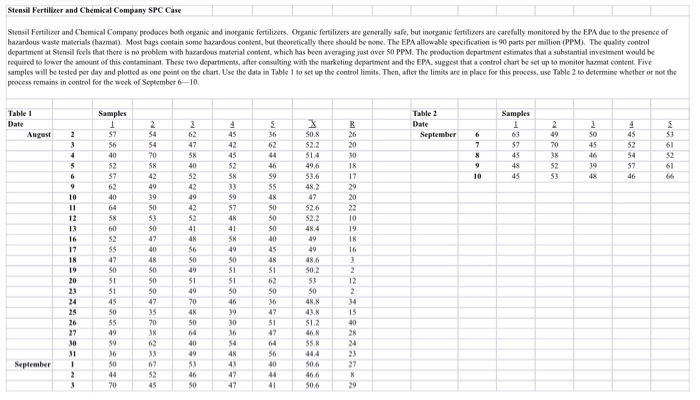
In the Florida plant, Angela McCormack, who holds engineering and MBA degrees, oversees a 15-member quality assurance staff. They watch all aspects of quality, including training employees on the factory floor, monitoring automated processing equipment, and developing and updating statistical process control (SPC) charts. The upper and lower control limits for one check point, salt content in Lay's chip, are 2.22% (UCL) and 1.98% (LCL), respectively. To see exactly how the limits are created using SPC, watch the Frito Lay Control Charts video in the Module below that accompanies this case. In the Excel document (below in this Module) you are going to create a new set of UCL and LCL measurements based on the below sample data and using the provided population parameter for standard deviation. Calculate the measurements and show your work. Question 1: How much of an improvement in variability did Frito-Lay make by implementing SPC? Question 2: What are the steps Karen Engels and Barbara Boudreau go through as part of a testing cycle? The data (in percent) from the initial trial samples using the new salting process are: Sample 1: 1.98 Sample 2: 1.99 Sample 3: 2.20 Sample 4: 2.18 2.11 2.0 2.10 2.01 Sample 5: 2.01 2.08 2.15 2.08 2.20 2.23 2.14 2.06 1.99 2.05 1.98 2.16 Stensill Fertilizer and Chemical Company SPC Case Stensil Fertilizer and Chemical Company produces both organic and inorganic fertilizers. Organic fertilizers are generally safe, but inorganic fertilizers are carefully monitored by the EPA due to the presence of hazardous waste materials (hazmat). Most bags contain some hazardous content, but theoretically there should be none. The EPA allowable specification is 90 parts per million (PPM). The quality control department at Stensil feels that there is no problem with hazardous material content, which has been averaging just over 50 PPM. The production department estimates that a substantial investment would be required to lower the amount of this contaminant. These two departments, after consulting with the marketing department and the EPA, suggest that a control chart be set up to monitor hazmat content. Five samples will be tested per day and plotted as one point on the chart. Use the data in Table I to set up the control limits. Then, after the limits are in place for this process, use Table 2 to determine whether or not the process remains in control for the week of September 6-10. Table 1 Date August September 2 3 4 5 6 9 10 11 12 13 16 17 18 19 20 anne- 23 24 25 26 27 30 31 1 2 3 Samples 1 57 56 40 52 529IASARES 57 62 40 64 58 60 55 47 50 $1 51 45 50 55 49 59 36 50 44 70 NARKOSRS 54 54 70 58 42 49 39 50 53 039383 50 47 40 48 50 50 50 47 35 70 38 120539 62 33 67 45 000000000000000000000 62 47 58 40 52 42 49 42 52 41 48 56 50 49 51 49 70 48 50 64 40 49 53 46 50 43555555 42 52 58 33 59 57 48 41 58 49 50 51 51 TASARA34095 46 36 48 47 47 MASERRR94452859 36 62 46 50 50 50 40 51 62 50 36 47 $1 47 64 56 40 44 41 X 50.8 52.2 51.4 49,6 53.6 48.2 47 52.6 52.2 48.4 49 49 48,6 50.2 53 50 48.8 43.8 51.2 46.8 55.8 44.4 50.6 46.6 50.6 42AAN2222ANANANA-% 26 20 29 20 19 18 40 28 23 27 29 Table 2 Date September 6 7 8 9 10 Samples 1 57 45 48 45 2 49 70 38 52 53 3 50 45 46 39 48 4 45 52 54 57 46 S 53 61 52 61
Step by Step Solution
★★★★★
3.51 Rating (161 Votes )
There are 3 Steps involved in it
Step: 1

Get Instant Access to Expert-Tailored Solutions
See step-by-step solutions with expert insights and AI powered tools for academic success
Step: 2

Step: 3

Ace Your Homework with AI
Get the answers you need in no time with our AI-driven, step-by-step assistance
Get Started


