Answered step by step
Verified Expert Solution
Question
1 Approved Answer
In the following table, actual and forecast demand values for 6 periods are given. Firstly, complete the table. Period Actual Forecastle 1 105 103 2
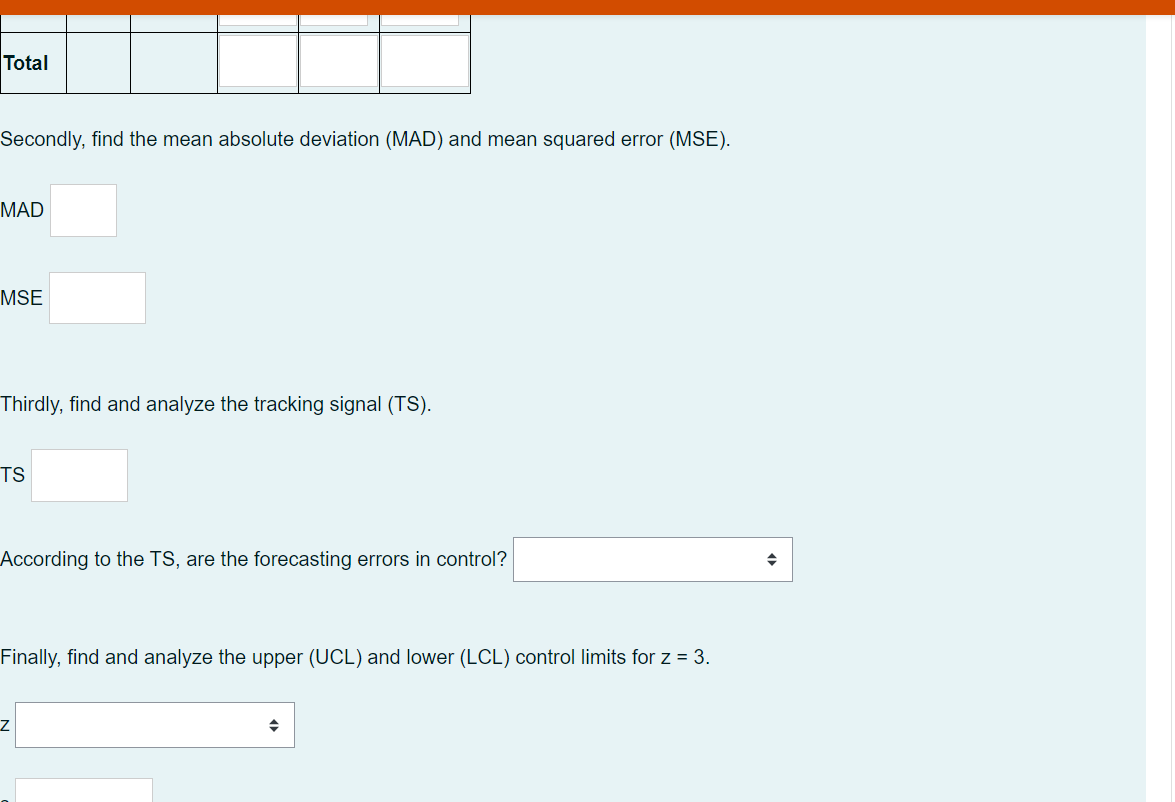
In the following table, actual and forecast demand values for 6 periods are given. Firstly, complete the table. Period Actual Forecastle 1 105 103 2 106 103 3 100 88 4 72 63 5 110 112 6 89 97 Total Secondly, find the mean absolute deviation (MAD) and mean squared error (MSE). MAD MSETotal Secondly, find the mean absolute deviation (MAD) and mean squared error (MSE). MAD MSE Thirdly, find and analyze the tracking signal (TS). TS According to the TS, are the forecasting errors in control? Finally, find and analyze the upper (UCL) and lower (LCL) control limits for z = 3. According to the TS, are the forecasting errors in control? Finally, find and analyze the upper (UCL) and lower (LCL) control limits for z = 3. Z S LCL UCL The corresponding control chart is as follows:The corresponding control chart is as follows: @Error @LCL eUCL According to the control chart, are the forecasting errors in control? O
Step by Step Solution
There are 3 Steps involved in it
Step: 1
Get Instant Access to Expert-Tailored Solutions
See step-by-step solutions with expert insights and AI powered tools for academic success
Step: 2
Step: 3
Ace Your Homework with AI
Get the answers you need in no time with our AI-driven, step-by-step assistance
Get Started