

Question
In the following table, find rate-of-return data over a 60-month period for Alphabet, the parent company of Google; the T-bill rate; and the S&P 500,
In the following table, find rate-of-return data over a 60-month period for Alphabet, the parent company of Google; the T-bill rate; and the S&P 500, which we will use as the market index portfolio. Please use Microsoft Excel to answer the questions below, and please paste screenshots from your Excel results as well.
| GOOG | S&P 500 | 3-month T-bills | |
| 201501 | 0.015426 | -0.03104 | 0.03% |
| 201502 | 0.044676 | 0.05489 | 0.02% |
| 201503 | -0.018625 | -0.01740 | 0.03% |
| 201504 | -0.01676 | 0.00852 | 0.02% |
| 201505 | -0.009733 | 0.01049 | 0.02% |
| 201506 | -0.0218 | -0.02101 | 0.02% |
| 201507 | 0.201917 | 0.01974 | 0.03% |
| 201508 | -0.011764 | -0.06258 | 0.07% |
| 201509 | -0.0159 | -0.02644 | 0.02% |
| 201510 | 0.168288 | 0.08298 | 0.02% |
| 201511 | 0.044724 | 0.00051 | 0.12% |
| 201512 | 0.021923 | -0.01753 | 0.23% |
| 201601 | -0.020991 | -0.05074 | 0.26% |
| 201602 | -0.060812 | -0.00413 | 0.31% |
| 201603 | 0.067615 | 0.06599 | 0.29% |
| 201604 | -0.069723 | 0.00270 | 0.23% |
| 201605 | 0.06163 | 0.01533 | 0.27% |
| 201606 | -0.059289 | 0.00091 | 0.27% |
| 201607 | 0.110808 | 0.03561 | 0.30% |
| 201608 | -0.002263 | -0.00122 | 0.30% |
| 201609 | 0.01335 | -0.00123 | 0.29% |
| 201610 | 0.009327 | -0.01943 | 0.33% |
| 201611 | -0.033778 | 0.03417 | 0.45% |
| 201612 | 0.018179 | 0.01820 | 0.51% |
| 201701 | 0.032352 | 0.01788 | 0.51% |
| 201702 | 0.033158 | 0.03720 | 0.52% |
| 201703 | 0.007714 | -0.00039 | 0.74% |
| 201704 | 0.092097 | 0.00909 | 0.80% |
| 201705 | 0.065014 | 0.01158 | 0.89% |
| 201706 | -0.058174 | 0.00481 | 0.98% |
| 201707 | 0.023957 | 0.01935 | 1.07% |
| 201708 | 0.00949 | 0.00055 | 1.01% |
| 201709 | 0.021058 | 0.01930 | 1.03% |
| 201710 | 0.059983 | 0.02219 | 1.07% |
| 201711 | 0.004692 | 0.02808 | 1.23% |
| 201712 | 0.024466 | 0.00983 | 1.32% |
| 201801 | 0.118062 | 0.05618 | 1.41% |
| 201802 | -0.055738 | -0.03895 | 1.57% |
| 201803 | -0.066025 | -0.02689 | 1.70% |
| 201804 | -0.014015 | 0.00272 | 1.76% |
| 201805 | 0.066507 | 0.02161 | 1.86% |
| 201806 | 0.028258 | 0.00484 | 1.90% |
| 201807 | 0.091077 | 0.03602 | 1.96% |
| 201808 | 0.000764 | 0.03026 | 2.03% |
| 201809 | -0.020292 | 0.00429 | 2.13% |
| 201810 | -0.097782 | -0.06940 | 2.25% |
| 201811 | 0.016401 | 0.01786 | 2.33% |
| 201812 | -0.053745 | -0.09178 | 2.37% |
| 201901 | 0.077983 | 0.07868 | 2.37% |
| 201902 | 0.00318 | 0.02973 | 2.39% |
| 201903 | 0.047673 | 0.01792 | 2.40% |
| 201904 | 0.012929 | 0.03931 | 2.38% |
| 201905 | -0.071394 | -0.06578 | 2.35% |
| 201906 | -0.020587 | 0.06893 | 2.17% |
| 201907 | 0.125607 | 0.01313 | 2.10% |
| 201908 | -0.02349 | -0.01809 | 1.95% |
| 201909 | 0.026008 | 0.01718 | 1.89% |
| 201910 | 0.033724 | 0.02043 | 1.65% |
| 201911 | 0.035592 | 0.03405 | 1.54% |
| 201912 | 0.024568 | 0.02859 | 1.54% |
- Use these data and Excels regression function to compute Googles excess return in each month as well as its alpha, beta, and residual standard deviation, (e), over the entire period.
- What was the Sharpe ratio of the S&P 500 over this period?
- What was Googles information ratio over this period?
- If someone whose risky portfolio is currently invested in an index portfolio such as the S&P 500 wishes to take a position in Google based on the estimates from parts (1)-(3), what would be the optimal fraction of the risky portfolio to invest in Google? Use Equations 6.16 and 6.17.
- Based on Equation 6.18 and your answer to part (4), by how much would the Sharpe ratio of the optimal risky portfolio increase given the incremental position in Google?
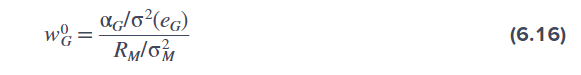
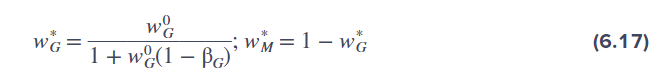
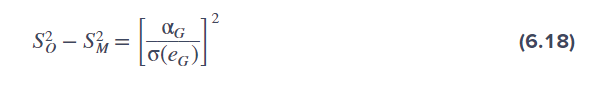
wG0=RM/M2G/2(eG) wG=1+wG0(1G)wG0;wM=1wG SO2SM2=[(eG)G]2
Step by Step Solution
There are 3 Steps involved in it
Step: 1

Get Instant Access to Expert-Tailored Solutions
See step-by-step solutions with expert insights and AI powered tools for academic success
Step: 2

Step: 3
Ace Your Homework with AI
Get the answers you need in no time with our AI-driven, step-by-step assistance
Get Started
Grow The Pie How Great Companies Deliver Both Purpose And Profit
Authors: Alex Edmans
1st Edition
1108494854,1108849482